UNITED STATES
SECURITIES AND EXCHANGE COMMISSION
Washington, D.C. 20549
SCHEDULE 14A
Proxy Statement Pursuant to Section 14(a) of the Securities
Exchange Act of 1934 (Amendment No. )
| Filed by the Registrant ☒ | ||
| Filed by a party other than the Registrant ☐ | ||
| Check the appropriate box: | ||
| ☐ | Preliminary Proxy Statement | |
| ☐ | Confidential, for Use of the Commission Only (as permitted by Rule 14a-6(e)(2)) | |
| ☒ | Definitive Proxy Statement | |
| ☐ | Definitive Additional Materials | |
| ☐ | Soliciting Material under §240.14a-12 | |
| CORNING INCORPORATED | ||
| (Name of Registrant as Specified In Its Charter) | ||
| (Name of Person(s) Filing Proxy Statement, if other than the Registrant) |
Payment of Filing Fee (Check all boxes that apply):
| ☒ | No fee required |
| ☐ | Fee paid previously with preliminary materials |
| ☐ | Fee computed on table in exhibit required by Item 25(b) per Exchange Act Rules 14a-6(i)(1) and 0-11 |
CORNING
2024 Notice of Annual Meeting |
![]()

“Our corporate strategy enables us to navigate through challenging periods like the present while maintaining an attractive long-term growth trajectory. Our distinctive capabilities have allowed us to establish a deep relevance to secular trends as we become ever more vital to progress. And our actions reflect a longstanding commitment to moving the world forward for all of our stakeholders.”

Dear Fellow Shareholder,
Corning Incorporated will host its 20232024 virtual Annual Meeting on April 27May 2 at noon Eastern Time.
This meeting is your opportunity to hear about Corning’s 2023 accomplishments, performance, and innovations as well as our expectations for the future. During the meeting, shareholders will vote on the annual election of directors, the advisory approval of our executive compensation, and the ratification of Corning’s independent registered public accounting firm for 2024.
Longstanding shareholders know that life-changing innovation is our purpose and drives everything that we do. And the essence of what we do at Corning is invent, make, and sell innovations that make the world just a little bit better. We drive durable, multiyear growth by inventing category-defining products, developing scalable manufacturing platforms, and building strong, trust-based relationships with customers who are leaders in their industries.
At the start of 2023, we introduced plans to improve profitability and cash flow. Throughout the year, we took action to restore our productivity ratios to historical levels and raised prices to more appropriately share inflation with our customers. Our results demonstrate that we continue to make solid progress advancing market leadership, strengthening our profitability, and improving our cash flow generation even in the lower-demand environment that we are experiencing.
We entered 2024 operationally strong, and we remain confident that key industry growth drivers are intact. These include wireless, broadband, 5G, cloud computing, and artificial intelligence in Optical Communications, increased screen sizes in Display Technologies, tighter emission regulations that drive more and better filtration in Environmental Technologies, and the frequencyneed for more advanced cover materials in Mobile Consumer Electronics. Therefore, we expect our markets to normalize in the midterm and return to growth. We are well-positioned to capture that growth with whichour strong market positions, established production capacity, and the necessary technical capabilities. This gives us the opportunity to deliver powerful incremental profit and cash to our shareholders.
Across our markets, we hold advisory votes on executive compensation.
I’ll also share details about Corning’s 2022 performance and our expectations for the future. Our corporate strategy enables uscontinue to navigate through challenging periods like the present while maintaining an attractive long-term growth trajectory. Our distinctive capabilities have allowed us to establish a deep relevance to secular trends as we become ever more vital to progress. And our actions reflect a longstanding commitment to movingmove the world forwardforward. I am proud that we continue to set the standard for alldurable, high-performance smartphone cover materials, such as Corning® Gorilla® Armor, which is featured on Samsung’s Galaxy S24 Ultra. I am proud that we continue to advance optical innovations in broadband, 5G, cloud computing, and artificial intelligence. And I am proud that we are advancing the driving experience by creating the next generation of automotive-interior displays; in fact, CES® named our stakeholders.LivingHinge™ Technology a 2024 “Best of Innovation Honoree” for enabling displays to dynamically bend.
We practice sound corporate governance by following industry best practices on executive pay, including tying compensation closelyare committed to company performance, and we communicate consistently and openlymaking the world a better place, not only with our shareholders. Furthermore, we continuously leverageinnovations, but also with our diverse board to ensure robust engagementactions. Corning strengthens the economy and critical oversight.
We’re also maintaining our commitment to our people and communities. Inside our walls, we’re focused on building a more inclusive work environment for our people – and we’re making steady progress. Notably, we reached our highest levelsenhances the quality of leadership diversity in 2022. A quarter of our corporate officers are women, and half of our Corporate Management Group is diverse. Beyond our walls, the company provides broad-based support to global humanitarian efforts as well as targeted local engagement to drive thriving communitieslife in the areascommunities where we live and work.
Importantly, every decision we make today is about tomorrow. With our future stakeholderswork with investments that include support for libraries, daycare centers, schools, arts and cultural organizations, economic development initiatives, and infrastructure improvements. And for the second year in mind, we published our second TCFD-aligned sustainability report in 2022, and we significantly improved our Corporatea row, Corning received a score of 100 on the Human Rights Benchmark score. And I’m pleasedCampaign Foundation’s Corporate Equality Index.
In 2024, we will build on our progress while continuing our mission to report that we are well ahead of achievingcreate life-changing innovations. I am grateful to our goal of 400 percent improvement in our use of renewable energy.
shareholders for being on this journey with us, and I look forward to sharing more details at the Annual Meeting.
You’ll find the formal meeting notice and the proxy statement in the following pages. I encourage you to vote your proxy card by phone or online by April 26May 1 so your shares will be represented at the meeting.
Thank you for your investment in Corning and your participation in our governance process.
Sincerely,


Wendell P. Weeks
Chairman of the Board and Chief Executive Officer
|


| Thursday, | ||
| 12 noon Eastern Time | ||
| To be held virtually at: virtualshareholdermeeting.com/ | ||
How to Attend Our Our You are entitled to participate in the Annual Meeting if you were a shareholder as of the close of business on To attend and vote your shares during the Annual Meeting, you will need to log in to virtualshareholdermeeting. com/ We urge you to vote and submit your proxy in advance of the meeting using one of the methods described in the proxy materials whether or not you plan to attend the Annual Meeting. You may vote your shares in advance at ProxyVote.com. |
ITEMS OF BUSINESS
| 1. | Election of |
| 2. | Advisory approval of our executive compensation (Say on Pay); |
| 3. | Ratification of the appointment of PricewaterhouseCoopers LLP as our independent registered public accounting firm for |
| Any other business or action that may properly come before the Annual Meeting or any adjournment or postponement of the Annual Meeting. |
WHO CAN VOTE
You may vote at our 20232024 Annual Meeting if you were a shareholder of record at the close of business on February 28, 2023.March 5, 2024.
Your vote is important to us. Please exercise your right to vote.
Important Notice Regarding the Availability of Proxy Materials for the Annual Meeting to be held on April 27, 2023:May 2, 2024: our proxy statement, our Annual Report on Form 10-K for the year ended December 31, 20222023 and other materials are available on our website at corning.com/2023-proxy.2024-proxy.
Sincerely,


Linda E. Jolly
Vice President and Corporate Secretary
March 17, 202322, 2024
VOTE RIGHT AWAY
Your vote is very important. Please promptly submit your proxy or voting instructions by Internet, telephone or mail to ensure the presence of a quorum. You may also vote during our Annual Meeting (subject to the circumstances described in the box at left). If you are a shareholder of record, you may vote during the meeting using the control number on the proxy card or the notice previously provided to you. If your shares are held in the name of a broker, nominee or other intermediary, such party can provide the control number to you. Shareholders without a control number may still attend the meeting as guests.
  |   |   | ||
| By telephone | By mail | By Internet | ||
| Dial toll-free 24/7 1-800-690-6903 | Cast your ballot, sign the proxy card and send by mail | Visit 24/7 ProxyVote.com |
| 2 | CORNING |


| CORNING | 3 |
Forward-Looking Statements and Materiality Disclaimer
The statements, estimates, projections, guidance or outlook contained in this document include “forward-looking” statements that are intended to take advantage of the “safe harbor” provisions of the federal securities law. The words “may,” “might,” “will,” “could,” “would,” “should,” “expect,” “plan,” “anticipate,” “intend,” “seek,” “believe,” “hope,” “want,” “strive,” “aim,” “goal,” “target,” “estimate,” “predict,” “potential,” “continue,” “contemplate,” “possible,” and similar words are intended to identify forward-looking statements. These statements may contain information about financial prospects, economic conditions and trends and involve risks and uncertainties. Our actual future results, including the achievement of our targets, goals or commitments, could differ materially from our projected results as a result of changes in circumstances, assumptions not being realized, or other risks, uncertainties and factors. Such risks, uncertainties and factors include but are not limited to unexpected delays, difficulties, and expenses in executing against our environmental, climate, diversity and inclusion or other “ESG” targets, goals and commitments outlined in this document, or our ability execute our strategies in the time frame expected or at all, changes in laws or regulations affecting us, such as changes in data privacy, environmental, safety and health laws and the risk factors discussed in our filings with the U.S. Securities and Exchange Commission, including our annual reports on Form 10-K and quarterly reports on Form 10-Q.
Historical, current, and forward-looking environmental and social-related statements may be based on standards for measuring progress that are still developing, and internal controls and processes that continue to evolve. Forward-looking and other statements in this document may also address our corporate responsibility and sustainability progress, plans, and goals, and the inclusion of such statements is not an indication that these contents are necessarily material for the purposes of complying with or reporting pursuant to the U.S. federal securities laws and regulations, even if we use the word “material” or “materiality” in this document.
Website references throughout this document are provided for convenience only, and the content on the referenced websites is not incorporated by reference into this document.
| 4 | CORNING |


This summary highlights information contained elsewhere in this proxy statement. This summary does not contain all of the information that you should consider, and you should read the entire proxy statement carefully before voting. As used in this proxy statement, “Corning,” the “Company” and “we” may refer to Corning Incorporated itself, one or more of its subsidiaries, or Corning Incorporated and its consolidated subsidiaries.
Proposals That Require Your Vote
| Proposal | Board Vote Recommendation | More Information |
| 1 Election of | For Each Nominee | page |
| 2 Advisory approval of our executive compensation (Say on Pay) | For | page |
| 3 Ratification of appointment of independent registered public accounting firm | For | page |
| Annual Meeting of Shareholders | ||
| Date and Time: | ||
| To be held virtually at: virtualshareholdermeeting. com/ | ||
| Record Date: | ||
| Admission: See the instructions contained in “Frequently Asked Questions about the Meeting and Voting” on page |
| CORNING | 5 |
Proxy Statement Summary
Business Information – Who We Are
Corning is one ofvital to progress – in the world’s leading innovatorsindustries we help advance and in materials science.the world we share. For more than 170 years, Corning has appliedcombined its unparalleled expertise in specialty glass ceramicsscience, ceramic science and optical physics with deep manufacturing and engineering capabilities to develop category-defining products that have created newtransform industries transformedand enhance people’s liveslives.
Our materials science and unleashed significant new capabilities.manufacturing expertise, boundless curiosity and commitment to purposeful invention place us at the center of the way the world works, learns and lives. In addition, our sustained investment in research, development and engineering capabilities means we are always ready to solve the toughest challenges alongside our customers. Our innovation approach delivers long-term value for Corning and its shareholders.
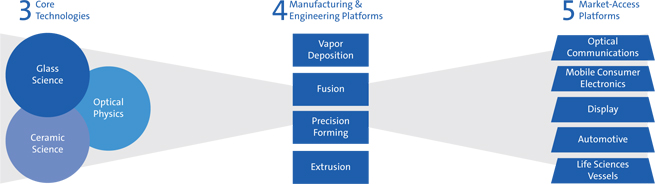
We are best-in-the-world in three core technologies, four manufacturing and engineering platforms, and five market-access platforms. Corning directs 80 percent or more of our resources to opportunities that draw from at least two of these capabilities sets. We believe this approach increases our likelihood of success, reduces the cost of innovation, creates higher barriers to entry for our competitors, and ultimately delights our customers.

The core of what we do is invent, make, and sell. We create value by inventing category-defining products, developing scalable manufacturing platforms, and building strong, trust-based relationships with customers who are leaders in their industries.
—Wendell P. Weeks, Chairman and Chief Executive Officer
Our 2022reportable segments are as follows:
| Reportable Segments* | 2023 Core Net Sales % | Segment Description |
| Optical Communications |  | manufactures carrier and enterprise network components and solutions for the telecommunications industry |
| Display Technologies |  | manufactures high quality glass substrates for flat panel displays including liquid crystal displays and organic light-emitting diodes |
| Specialty Materials |  | manufactures glass, glass ceramics and other advanced optic materials to meet a wide range of advanced needs in diverse industries |
| Environmental Technologies |  | manufactures ceramic substrates and filters for emissions control systems in mobile applications |
| Life Sciences |  | develops, manufactures and supplies labware, equipment, media, serum and reagents to enable workflow solutions for drug discovery and bioproduction |
* All other businesses that do not meet the quantitative threshold for separate reporting have been grouped as “Hemlock and Emerging Growth Businesses.” Net sales for this group are mainly attributable to Hemlock Semiconductor Group (HSG), an operating segment producing solar and semiconductor products. The Emerging Growth Businesses consists primarily of our pharmaceutical technologies business, automotive glass solutions business and the emerging innovations group. Hemlock and Emerging Growth Businesses represented 10% of our 2023 Core Net Sales.
| 6 | CORNING 2024 PROXY STATEMENT |
Proxy Statement Summary
Our 2023 Results
| |||
$ million | $
|
| |
$ million Core Net Sales | $
| ||
| 2023 Cash Flow Results | $2,005 million | $ million
|
*Adjusted free cash flow is a Non-GAAP measure. Refer to Appendix A for more information.
**Cash flows from operating activities less capital expenditures. See Appendix A.
CORE PERFORMANCE MEASURES
In managing the Company and assessing our financial performance, we adjust certain measures provided byincluded in our consolidated financial statements to arrive at measures that are not calculated in accordance with accounting principles generally accepted in the United States of America (“GAAP”) and exclude specific items that are non-recurring, related to foreign exchange volatility, or unrelated to continuing operations. These measures are our Core Performance Measures. Our management uses Core Performance Measures, along with financial measures in accordance with GAAP, to make financial and operational decisions. We believe that sharing our Core Performance Measures with investors provides greater visibility into how we make business decisions. Accordingly, these measures also form the basis for our compensation program metrics.
Items that are excluded from certain Core Performance calculations include: the impact of translating Japanese yen-denominated debt, the impact of translated earnings contracts, acquisition-related costs, certain discrete tax items and other tax-related adjustments, restructuring, impairment and other charges and credits, certain litigation, regulatory and other legal matters, pension mark-to-market adjustments and other items which do not reflect on going operating results of the Company. More information on these items can be found in Appendix A.
Corning utilizes constant-currency reporting for our Display Technologies, Environmental Technologies, Specialty Materials and Life Sciences segments for the Japanese yen, South Korean won, Chinese yuan, newNew Taiwan dollar, and the euro, as applicable to the segment. The Company believes that the use of constant-currency reporting allows investors to understand our results without the volatility of currency fluctuations and reflects the underlying economics of the translated earnings contracts used to mitigate the impact of changes in currency exchange rates on our earnings and cash flows..
These non-GAAP measures are not an alternative to, or a replacement for, financial results determined in accordance with GAAP. Please see Appendix A to this proxy statement for a reconciliation of the non-GAAP measures we use in this proxy statement to the most directly comparable GAAP financial measures.
| CORNING |
Proxy Statement Summary
Our reportable segments are as follows:
|
| |
 | ||
 | ||
 | ||
 |
* All other businesses that do not meet the quantitative threshold for separate reporting have been grouped as Hemlock and Emerging Growth Businesses. This group is primarily comprised of the results of Hemlock Semiconductor Group (HSG), which produces polysilicon products. Hemlock and Emerging Growth Businesses also includes our pharmaceutical technologies business, automotive glass solutions business, new product lines and development projects, as well as other businesses and certain corporate investments. Hemlock and Emerging Growth Businesses represented 11% of our 2022 Core Net Sales.
2022 Performance Highlights: Strategic Resilience in a Challenging External Environment
In 2022, Corning grew core net sales to $14.8 billion, driven by our strong positions in the growing optical communications and solar markets and ongoing outperformance across our end markets. Corning continued to deliver sales growth despite demand headwinds in markets constituting around half of our sales. At the same time, prioritizing our commitment to fulfill our customer needs in a higher inflation environment caused profitability and cash flow to lag sales growth. The Company took additional price and productivity improvement actions to preserve profitability, and improve margins and cash generation. The Company’s focus on executing these priorities resulted in core net sales growth of 5% and core EPS growth of 1%, building on our strong results of 2021.
Stepping back, our long-term growth drivers all remain intact. We are well positioned to capture profitable multi-year growth as our end markets recover, and will continue to execute with discipline. Our cohesive and diversified portfolio provides strategic resilience that has come to bear in the current economic environment. We have established deep relevance to secular trends along with the proven ability to drive more content into our markets over time. We have been leading in the automotive and life science markets for 100 years, display market for 80 years, telecommunications market for 50 years and mobile consumer electronics since the inception of smart devices. The basis of our ongoing success is our distinctive set of capabilities and long track record of life-changing and even life-saving inventions which, as in the past, is what enables us to power through moments like the present while maintaining an attractive long-term growth trajectory.
Corning’s Strategy in Action
Corning strives to be a catalyst for positive change and to help move the world forward. The company drives profitable multiyear growth by inventing, making, and selling life-changing products while cultivating deep, trust-based relationships with industry leaders, ultimately incorporating more content into customers’ offerings. To do so, Corning takes a long-view approach, investing in a set of vital capabilities that are becoming increasingly relevant to profound transformations that touch many facets of daily life. Today, Corning’s markets include optical communications, mobile consumer electronics, display, automotive, solar, semiconductor, and life sciences.
| 7 |
Proxy Statement Summary
2022 highlights include:2023 Performance Highlights: Delivering Operational Objectives
At the start of 2023, we introduced plans to improve profitability and cash flow. Throughout the year, we took action to restore our productivity ratios to historical levels and to raise price to more appropriately share inflation with our customers. Our results demonstrated that we continue to make solid progress advancing market leadership, strengthening our profitability, and improving our cash flow generation even in the lower-demand environment that we are experiencing.
Although demand in most of our markets is temporarily depressed due to supply chain corrections and macroeconomic factors, we are entering 2024 operationally strong and we remain confident that key industry growth drivers are intact: specifically, wireless, broadband, 5G, cloud computing and advanced artificial intelligence in Optical communications, increased screen sizes in Display Technologies, tighter emission regulations that drive more and better filtration in Environmental Technologies and the need for more and more advanced cover materials in Mobile Consumer Electronics. Additionally, we have built competitively-advantaged positions in the markets in which we participate and we believe we are the technology leader, as well as the lowest-cost producer, in those markets.
Therefore, as we expect our markets to normalize in the midterm, we believe we are well-positioned with the production capacity and technical capabilities necessary to capture this growth opportunity and deliver powerful incremental profit and cash to our shareholders.
2023 HIGHLIGHTS
| • | Helping industry leaders advance the form and function of smartphones through step changes in engineered glass and glass-ceramics. |
| • |
| • | Ultra-thin bendable glass: For half a century, Corning has helped propel display and cover | |
| • | Advancing precision automotive glass to | |
| • | Contributing to |
| • | The Science Based Targets |
| • |
| • | The Company also |
| • |
| 8 | CORNING |
Proxy Statement Summary
Update on Our Leadership Priorities
In 2019, we outlined our leadership priorities for growth and shareholder returns, highlighting significant opportunities to sell more Corning content through each of our Market-Access Platforms, which we call our “More Corning” strategy.
The Company’s focused and cohesive portfolio and financial strength provide strategic resilience. Corning has and will continue to use its cash to grow, extend its leadership and reward shareholders. Our key growth drivers remain intact, and some are accelerating as key trends converge around Corning’s capabilities.
Corning continues to advance its leadership priorities and articulate opportunities across its business. Our probability of success increases as we invest in our world-class capabilities. Corning is concentrating approximately 80% of its research, development and engineering investment along with capital spending on a cohesive set of three core technologies, four manufacturing and engineering platforms, and five Market-Access Platforms. This strategy allows us to quickly apply our talents and repurpose our assets across the Company, as needed, to capture high-return opportunities.
| Over the past five years, including |
| ANNUAL DIVIDENDS PER COMMON SHARE AND INCREASE OVER PRIOR YEAR | ||
 |
| CORNING | 9 |
Proxy Statement Summary
Sustainability Matters at Corning
We believe that our innovations have transformed industries, enhanced people’s lives and addressed some of society’s biggest challenges. In accordance with Corning’s Values, we also believe a commitment to positiveimproved environmental, social and governance-related business practices increases shareholder value, drives performance, strengthens our Company, increases our connection with our shareholders, and helps us better serve our customers and the communities in which our employees live and we operate. We see these commitments as new opportunities to deliver value to our shareholders, our employees, our customers, and the wider world.
Corning Sustainability Governance Structure

Our commitment to sustainability starts at the top of our organization. Four committees of our Board of Directors provide oversight in the development and Climate Governanceexecution of our sustainability efforts. These board committees receive briefings on relevant sustainability impact areas at every committee meeting. Our Office of the CEO (OCEO) has ultimate accountability for our strategy and performance, coordinating five sustainability categories. Each of the five categories bundle several related sustainability topics and are overseen by individual Advice & Consent Committees (ACC). Each ACC consists of expert senior leaders and our vice president of sustainability and climate initiatives. Our MAPs are responsible for implementing Corning’s sustainability efforts throughout the business.
Our vice president of sustainability and climate initiatives, reporting to our executive vice president and chief strategy officer, leads our Sustainability Center of Excellence. Working closely with our senior leadership team, the OCEO, and sustainability leads from our MAPs and other business units, this position oversees the Company’s sustainability efforts and progress toward our goals.
Employees at every level contribute to the achievement of our sustainability goals. Many decide to go even further by joining the Corning Sustainability Network. Marking its second year in 2023, this grassroots initiative gives employees an opportunity to broaden their sustainability knowledge, participate in community events, and network with other Corning employees who share their passion.
 |
| |
 |
| |
 |
|
| 10 | CORNING |
Proxy Statement Summary
Our Sustainability Goals
In 2020, Corning adopted 12 sustainability goals to drive progress toward those areas where we can achieve the greatest impact. Corning’s goals were adopted after an assessment that identified issues most important to the Company and its stakeholders. Corning has committed to reduce its Scope 1 and 2 greenhouse gas (GHG) emissions by 30% (absolute basis) and relevant Scope 3 GHG emissions by 17.5% (absolute basis) by 2028 compared to a 2021 baseline. In 2021, we set our first carbon reduction goals as part of our ongoing climate action plan. The goals align with the Sustainable Development Goals (SDGs) adopted by the United Nations in 2015 as a “blueprint to achieve a better and more sustainable future for all.” Our Sustainability Report is prepared in reference to the Global Reporting Initiative’s (GRI) standards, includes reporting in alignment with the TCFD, and responds to the Hardware Sustainability Accounting Standard, the Sustainability Accounting Standards Board (SASB) sector-specific standard most relevant for our business.
|
|
|
Proxy Statement Summary
Our Commitment to Sustainability
Corning demonstrates its commitment to environmental, social, governance and human capital matters, and its Values, in many ways that can be explored in our 20222023 Sustainability Reportand our Sustainability website, both which can be found at corning.com/sustainability. .
CLIMATE
| • In 2021, Corning committed to reduce Scope 1 and 2 GHG emissions by 30% (absolute basis) and relevant Scope 3 GHG emissions by 17.5% (absolute basis) by 2028 compared to a 2021 baseline. |
• In furtherance of its Scope 1, 2 and 3 GHG emissions goals set in 2021, in • In | |
ENVIRONMENTAL
| • Corning is committed to protecting the environment through the continuous improvement of our processes, products and services.For example, • We are proud of our sustained participation and strong performance in the • In 2023, • In 2023, we commenced our Scope 3 supplier engagement program with suppliers that make up 80% of |
HEALTH AND
 | • Corning continues to maintain its best-in-class health and safety performance,ranking in the top quartile of global, industry-leading company performance as measured by a total case incidence rate. • Corning achieved over 95% compliance with corporate health and safety standards at Corning sites in •
|
Proxy Statement Summary
DIVERSITY, EQUITY
| • Diversity, equity, and inclusion are integral to Corning’s belief in the fundamental dignity of The Individual – one of Corning’s seven core Values. We are committed to providing an inclusive environment where all employees can thrive. You can explore the Company’s Diversity, Equity and Inclusion Reportat https://www.corning.com/worldwide/en/sustainability/people/diversity.html. •
• In •
|
HUMAN CAPITAL
| •
• In 2021, we achieved • In • In 2023, Corning also •
|
Proxy Statement Summary
Supply Chain Sustainability
Corning is committed to a strategic, integrated and socially responsible supply chain – one that reflects our seven core Values, all the time, all around the world. Even when faced with a global pandemic, our commitment has been unwavering. We are dedicated to not only living our Values ourselves, but holding our suppliers accountable to do the same. Our Values are embedded in our Supplier Code of Conduct – enforcement of the Code is of utmost importance and we proactively leverage tools and processes to manage our suppliers, holding them to the highest degree of ethical and socially responsible standards. We work to ensure compliance to all laws and regulations, with particular focus on those which seek to put an end to forced labor and human trafficking, and we continuously look for ways to expand the scope of our efforts to the benefit of all involved.
![]()
Our Supplier Code of Conduct can be viewed at https://www.corning.com/worldwide/en/sustainability/processes/supply-chain-social-responsibility/supplier-responsibility.html
| CORNING |
Proxy Statement Summary
Supporting SustainableConnections in Our Communities
Throughout its history, Corning has routinely made contributions to civic, educational, charitable, cultural and other institutions that improve the quality of life and increase the resources of the communities in which it operates, making Corning more attractive to employees.
The Company undertakes its philanthropic activities directly through corporate initiativesIn 2023, we combined the Corning Incorporated Foundation, Corning Enterprises, and initiatives of itsour Office of Racial EquityEquality and Social Unity (ORESU),into a new consolidated function and indirectly through The Corning Incorporated Foundation (the Foundation),center of excellence called Community Impact & Investment. This centralizes our U.S. philanthropic contributions under a separate 501(c)(3) organization. We believesingle organization, allowing us to maximize our impact in being an active corporate citizen and both Corningthe areas that align most closely with our values and the Foundation direct the vast majorityneeds of their grant-making and activities in the communities where Corning operates and its employees live. In 2022, Corning donated $2 million to the Foundation, and the Foundation disbursed approximately $5.3 million in direct grants to non-profit organizations which includes grants made under the Foundation’s Employee Programs (Employee Matching Gifts, Dollars for Doers, Vibrantwe operate. For more information about Corning's Community Grants and Excellence in Volunteerism Awards). A sampling of the ways that Corning and the Corning Foundation made an impact inImpact & Investment outreach, please see our communities in 2022 included:2023 Sustainability Report.
Corning’s direct giving also includes annual contributions to both local and international cultural and educational institutions. In particular, Corning isAmong them, we are proud to support The Corning Museum of Glass (CMOG) – the world’s leading glass museum. Beyond just a key cultural and community hub, CMOG also provides Corning with a unique innovation crucible where our glass scientists and experts collaborate with glass artists and designers to creatively explore the novel properties of glass and innovate new uses in an environment uninhibited by traditional commercial boundaries. In a small community,
Proxy Statement Summary
our employees, including executives and their families, inevitably have relationships with the non-profit organizations that receive such contributions from the Company. Wendell P. Weeks (chairman and CEO), Jeffrey W. Evenson (executive vice president and chief strategy officer) and Edward A. Schlesinger (executive vice president and CFO) serve on the CMOG board of trustees. In 2022,2023, Corning provided cash and non-cash contributions of services to CMOG of approximately $42$39 million.
Corning provides financial support to the Alternative School for Math and Science (ASMS), a private middle school located in Corning, New York, with an advanced curriculum focused on science and math. Currently, children of Corning employees represent approximately 51%53% of its enrollment. In 2022,2023, Corning’s non-cash contributions totaled approximately $1.7$1.6 million and cash contributions totaled $346,000. Kim Frock Weeks (spouse of Wendell P. Weeks, our chairman and CEO) serves on the ASMS board of trustees and also serves as the executive head of school but receives no salary or benefits in this role.
| CORNING 2024 PROXY STATEMENT | 13 |
2022
Proxy Statement Summary
2023 Executive Compensation Program
As shown below, in 2022In 2023 approximately 91% of our CEO’s target total compensation and 81%84% of the other Named Executive Officers’ (NEOs) target total compensation (in both cases excluding employee benefits and perquisites), was variable and dependent on Corning’s business, operating and financial performance or stock price.
2023 Compensation Components*
| CEO | ALL OTHER NEOs | |
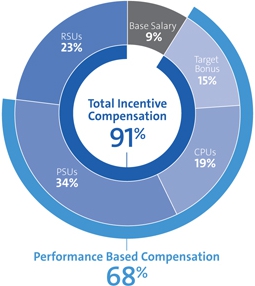  |  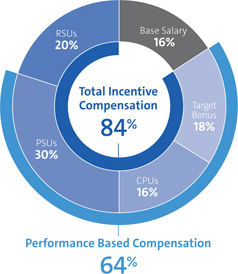 |
RSUs – Restricted Stock Units
PSUs – Performance Stock Units
CPUs – Cash Performance Units
* The chart reflects ordinary target compensation elements. In 2023 we utilized a Cash for Equity Exchange Program whereby each NEO voluntarily exchanged a portion of their cash salary for RSUs, and their 2023 cash PIP was automatically exchanged for PSUs (see page 60 for more details on the 2023 Cash for Equity Exchange Program).
| CORNING |
Proxy Statement Summary
20222023 Pay Components
| Pay Component | Form and Payout
| Purpose | Award Value | ||||
| Base Salary | Cash - fixed | • Attract and retain talent • Provide financial certainty | • Value of role to the Company • Value of role in competitive marketplace • Skills and performance • Internal equity | ||||
| Short-Term Incentives (STI) | |||||||
| •GoalSharing Plan | Cash - variable | • Focus all employees on delivering annual unit and business scorecard objectives | • Generally targeted at 5% of base salary based on annual corporate performance and business unit objectives | ||||
| •Performance Incentive Plan (PIP) | Cash - variable | • Provide additional incentive to executives to deliver specific annual corporate and business financial plans | • Target awards are set individually based on the competitive marketplace and level of experience • | ||||
Long-Term Incentives (LTI) •Cash Performance Units •Performance Stock Units •Restricted Stock Units | 25% cash and 75% stock, 70% performance-based (CPUs and PSUs) and 30% time-based (RSUs) | • Focus executives on long-term results • Align the long-term interests of executives and shareholders • Ensure equity ownership for executive team • Reward achievement of long-term objectives over the three-year measurement period • Retain talent | • Target awards are based on competitive marketplace, level of executive, skills and performance • Actual units earned relative to target is based on corporate performance against pre-set goals • Value of PSUs and RSUs is tied directly to the price of our common stock | ||||
All Other: •Benefits •Perquisites •Severance Protection | Ongoing or Event-Driven | • Support the health and security of our executives, and their ability to plan for retirement • Enhance executive productivity | • Employee health and safety • Competitive marketplace • Level of executive |
Our Metrics and Why We Use Them | |
Core Earnings per Share (Core EPS): Core EPS is our key measure of profitability. (Note: Corning budgets for share repurchases when establishing annual financial Core Net Sales: Growing core net sales—both organically through innovation and through acquisitions —remains critical to our short | Adjusted Free Cash Flow: Strong cash generation enables us to invest in future growth, sustain leadership in our markets, Return on Invested Capital (ROIC): We focus on ROIC because it reflects our ability to generate returns from the capital we have deployed in our |
Core net sales is a primary indicator of Corning’s long- and short-term success. Evaluating performance against predetermined net sales metrics provides insight into how well the Company has retained sales and met sales growth targets, accounting for both organic growth efforts and the impact of acquisitions. We use core net sales as a performance measure in our annual bonus plans (GoalSharing and PIP) because GoalsharingGoalSharing impacts every employee and PIP impacts over 8,000 employees. In this way, every employee has goal alignment with Corning’s sales growth goals. The LTI plan, which impacts approximately 350 senior executives and key employees responsible for driving the short- and long-term financial growth of the Company, also includes a core net sales performance measure. Incorporating net sales into both the STI and LTI plans allows for a comprehensive evaluation of Corning’s ability to establish sustainable sales growth while also addressing near-term market fluctuations. It is a “duplicate goal” for only about 350 of our approximately 57,00049,800 employees, and the Compensation and Talent Management Committee believes the increased focus on core net sales growth is appropriate for that smaller group of executives given the importance of sales growth for Corning over time.
| CORNING |
Proxy Statement Summary
20222023 Compensation Plan Payout Percentages
The following table reflects our 20222023 compensation plan’s payout percentages based on our 20222023 financial performance:
| SHORT TERM INCENTIVE PLAN | Long Term Incentive Plan | ||||||||||||||||
| ANNUAL CASH BONUS – GOALSHARING | CASH PERFORMANCE UNITS AND PERFORMANCE STOCK UNITS (70% OF LTI TARGET — 2022 PERFORMANCE RESULTS) | ||||||||||||||||
| Components | Weighting | % of target earned | Components | Weighting | % of target earned | ||||||||||||
| Corporate financial performance | 25% | 66% | Adj Free Cash Flow | 70% | 30% | ||||||||||||
| Average of all unit plans (>100 units) | 75% | 128% | Core Net Sales | 30% | 93% | ||||||||||||
| 2022 payout (% of target) | 113%* | 2022 blended performance result | 49% | ||||||||||||||
| * Equal to 5.65% of base salary for each NEO based on a 5% target. | |||||||||||||||||
| ANNUAL CASH BONUS – PIP | LTI PLAN PAYOUT FOR 3-YEAR PERIOD ENDING DECEMBER 31, 2022 | ||||||||||||||||
| Components | Weighting | % of target earned | Components | % of target earned | |||||||||||||
| Corporate financial performance | 50% | 66% | 2020 performance result | 181% | |||||||||||||
| Average of 5 MAPs financial performance | 50% | 59% | 2021 performance result | 175% | |||||||||||||
| 2022 payout (% of target) | 62.5% | 2022 performance result | 49% | ||||||||||||||
| 2020-2022 average performance | 135% | ||||||||||||||||
| ROIC MODIFIER | +10% | ||||||||||||||||
2020-2022 average performance | × | ROIC Modifier | = | Final % pay-out of 2020 target CPUs and PSUs | |||||||||||||
| 135% × 110% | = | 148.5% Final Payout (% of target) | |||||||||||||||
| SHORT TERM INCENTIVE PLAN | LONG TERM INCENTIVE PLAN | |||||||||||||||
| ANNUAL CASH BONUS – GOALSHARING | CASH PERFORMANCE UNITS AND PERFORMANCE STOCK UNITS (70% OF LTI TARGET — 2023 PERFORMANCE RESULTS) | |||||||||||||||
| Components | Weighting | % of target earned | Components | Weighting | % of target earned | |||||||||||
| Corporate financial performance | 25% | 51% | Adjusted Free Cash Flow | 70% | 58% | |||||||||||
| Average of all unit plans (>100 units) | 75% | 129% | Core Net Sales | 30% | 53% | |||||||||||
| 2023 payout (% of target) | 109.6%* | 2023 blended performance result | 56% | |||||||||||||
| * Equal to 5.48% of base salary for each NEO based on a 5% target. | ||||||||||||||||
| 2023 CASH FOR EQUITY EXCHANGE PROGRAM PIP PERFORMANCE STOCK UNITS FOR NEOS | LTI PLAN PAYOUT FOR 3-YEAR PERIOD ENDING DECEMBER 31, 2023 | |||||||||||||||
| Components | Weighting | % of target earned | Components | % of target earned | ||||||||||||
| Corporate financial performance | 100% | 51% | 2021 performance result | 175% | ||||||||||||
| 2023 payout (% of target) | 51% | 2022 performance result | 49% | |||||||||||||
| 2023 performance result | 56% | |||||||||||||||
| 2021-2023 average performance | 93% | |||||||||||||||
| ROIC MODIFIER | +2.5% | |||||||||||||||
| 2021-2023 average performance | × | ROIC Modifier | = | Final % pay-out of 2021 target CPUs and PSUs | ||||||||||||
| 93% × 1.025% | = | 95.33% Final Payout (% of target) | ||||||||||||||
| CORNING |
Proxy Statement Summary
Our Director Nominees
All director nominees are independent with the exception ofexcept Mr. Weeks.
| Name and Primary Occupation | Age | Director since | Committee Memberships* | Other Public Company Boards |
Donald W. Blair Retired Executive Vice President and Chief Financial Officer, NIKE, Inc. | 64 | 2014 | • Audit • Finance | 1 |
Leslie A. Brun Chairman and Chief Executive Officer, Sarr Group, LLC | 70 | 2018 | • Audit • Compensation | 1 |
Stephanie A. Burns Retired Chairman and Chief Executive Officer, Dow Corning Corporation | 68 | 2012 | • Audit • Corporate Responsibility (Chair) | 2 |
Richard T. Clark, Lead Independent Director Retired Chairman, Chief Executive Officer and President, Merck & Co., Inc. | 77 | 2011 | • Compensation • Executive • Governance | 0 |
Pamela J. Craig Retired Chief Financial Officer, Accenture plc. | 66 | 2021 | • Audit • Corporate Responsibility | 3 |
Robert F. Cummings, Jr. Retired Vice Chairman of Investment Banking, JPMorgan Chase & Co. | 73 | 2006 | • Executive • Finance (Chair) • Governance | 0 |
Roger W. Ferguson, Jr. Retired President and Chief Executive Officer, TIAA | 71 | 2021 | • Compensation • Governance | 2 |
Deborah A. Henretta Retired Group President of Global E-Business, Procter & Gamble Company | 61 | 2013 | • Corporate Responsibility • Information Technology | 3 |
Daniel P. Huttenlocher Dean, MIT Stephen A. Schwarzman College of Computing | 64 | 2015 | • Finance • Information Technology | 1 |
Kurt M. Landgraf Retired President, Washington College | 76 | 2007 | • Audit (Chair) • Compensation • Executive | 0 |
Kevin J. Martin Vice President, US Public Policy, Meta Platforms, Inc. | 56 | 2013 | • Corporate Responsibility • Governance | 0 |
Deborah D. Rieman Retired Executive Chairman, Metamarkets Group | 73 | 1999 | • Compensation (Chair) • Information Technology | 0 |
Hansel E. Tookes II Retired Chairman and Chief Executive Officer, Raytheon Aircraft Company | 75 | 2001 | • Compensation • Executive • Governance (Chair) | 1 |
Wendell P. Weeks Chairman and Chief Executive Officer, Corning Incorporated | 63 | 2000 | • Executive (Chair) | 1 |
Mark S. Wrighton President, George Washington University | 73 | 2009 | • Finance • Information Technology (Chair) | 0 |
| Name and Primary Occupation | Age | Director since | Committee Memberships* | Other Public Company Boards | |
 | Leslie A. Brun Chairman and Chief Executive Officer, | 71 | 2018 | • Audit • Compensation | 1 |
 | Stephanie A. Burns Retired Chairman and Chief Executive Officer, | 69 | 2012 | • Audit • Corporate Responsibility (Chair) | 2 |
 | Pamela J. Craig Retired Chief Financial Officer, | 67 | 2021 | • Audit • Corporate Responsibility | 2 |
 | Robert F. Cummings, Jr. Retired Vice Chairman of Investment Banking, | 74 | 2006 | • Executive • Finance (Chair) • Governance | 0 |
 | Roger W. Ferguson, Jr. Steven A. Tananbaum Distinguished | 72 | 2021 | • Compensation • Governance | 2 |
 | Thomas D. French Senior Partner Emeritus, | 64 | 2023 | • Audit • Corporate Responsibility | 0 |
 | Deborah A. Henretta Retired Group President of Global E-Business, | 62 | 2013 | • Corporate Responsibility • Information Technology | 3 |
 | Daniel P. Huttenlocher Dean, MIT Stephen A. Schwarzman | 65 | 2015 | • Finance • Information Technology | 1 |
 | Kurt M. Landgraf Retired President, Washington College | 77 | 2007 | • Audit (Chair) • Compensation • Executive | 0 |
 | Kevin J. Martin Vice President, US Public Policy, | 57 | 2013 | • Corporate Responsibility • Governance | 0 |
 | Deborah D. Rieman Retired Executive Chairman, | 74 | 1999 | • Compensation (Chair) • Information Technology | 0 |
 | Hansel E. Tookes II Retired Chairman and Chief Executive Officer, | 76 | 2001 | • Compensation • Executive • Governance (Chair) | 0 |
 | Wendell P. Weeks Chairman and Chief Executive Officer, | 64 | 2000 | • Executive (Chair) | 1 |
 | Mark S. Wrighton Professor and Chancellor Emeritus, | 74 | 2009 | • Finance • Information Technology (Chair) | 0 |
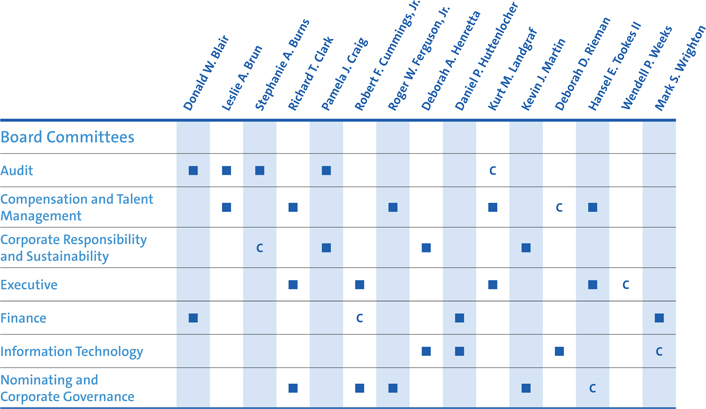
*Audit = Audit Committee; Compensation = Compensation and Talent Management Committee; Corporate Responsibility = Corporate Responsibility and Sustainability Committee; Executive = Executive Committee; Finance = Finance Committee; Governance = Nominating and Corporate Governance Committee; Information Technology = Information Technology Committee
| CORNING |
Proxy Statement Summary
Governance Highlights
Corning is committed to maintaining strong corporate governance as a critical component of driving sustained shareholder value. The Board of Directors continually monitors emerging best practices in governance to best serve the interests of the Company’s stakeholders.
| |
|
|
Shareholder Communication
Communicating with shareholders, particularly about our strategic priorities, is critically important to Corning. We communicate with our shareholders through a number of channels, including quarterly earnings calls, U.S. Securities and Exchange Commission (SEC) filings, Investor Days, investor conferences, our website at corning.com and other electronic communications. Our executives and Board members also routinely engage with investors through in-person meetings and calls.
In addition to regular discussions regarding our strategic priorities, we also conduct regular shareholder outreach to understand perspectives on our governance practices, including our sustainability initiatives, Board composition, human capital management, and executive compensation. Members of our Board often participate in direct interaction with our shareholders, and investor feedback is regularly shared with Board members to inform decision making.
As part of our shareholder governance outreach in the 2022-2023 proxy season:
More information on our shareholder engagement can be found on page 65.

Corporate Governance
Our Board of Directors employs practices that foster effective Board oversight of critical matters such as strategy, management succession planning, financial and other controls, risk management and compliance. The Board reviews our major governance policies, practices and processes regularly in the context of current corporate governance trends, investor feedback, regulatory changes and recognized best practices. Corning also aligns its corporate governance practices with the Investor Stewardship Group’s (ISG) Corporate Governance Framework for U.S. Listed Companies.
The following sections provide an overview of our corporate governance structure and processes, including key aspects of our Board operations, and how they align with the ISG Principles.
to shareholders. | |
their perspectives | |
Corporate Governance and the Board of Directors
A matrix of relevant skills can be found on page 39. | |
Corporate Governance and the Board of Directors
Board Leadership Structure
The Company’s Corporate Governance Guidelines provide the Board with the flexibility to select the appropriate leadership structure for the Company. Annually, the Board must review whether the role of Chairman should be a non-executive position or combined with that of the CEO. In making determinations about the leadership structure, the Board considers many factors, including the specific needs of the business and what is in the best interests of the Company’s shareholders. The current leadership structure comprises a combined Chairman and CEO, a Lead Independent Director, Board committees led primarily by independent Directors and active engagement by all Directors. The Board believes that this structure provides an effective balance between strong Company leadership and appropriate safeguards and oversight by independent Directors.
In February 2023, the Board determined that our combined Chairman and CEO, supported by our Lead Independent Director, continues to provide strong leadership and oversight and ensures effective functioning of management and the Company. The Board believes that having one person serve as Chairman and CEO can provide certain synergies and efficiencies that enhance the functioning of the Board and, importantly, allow it to most effectively execute its role in overseeing business strategy. Mr. Weeks’ vast knowledge of our Company, our diverse products and business lines, our global operations, the nuances of the innovation pipeline and the challenges and opportunities particular to Corning make him uniquely suited to identify many of the business issues that require Board attention. As Chairman, he is best positioned to focus Directors’ attention on the most critical business matters.
Richard T. Clark was re-appointed to the role of Lead Independent Director by the independent directors effective February 8, 2023, pursuant to the requirement of our Corporate Governance Guidelines that when the Chairman and CEO roles are combined, the independent directors annually appoint a Lead Independent Director from their membership. Mr. Clark’s understanding of the Company and the industry, his experience on other public boards, and his management expertise as the former Chairman, Chief Executive Officer and President of Merck & Co., Inc. enables him to assure independent board leadership at the Company. The Board is comprised solely of independent directors other than the CEO, and 100 percent of the Audit, Compensation and Talent Management, Corporate Responsibility and Sustainability, Finance, Information Technology and Nominating and Corporate Governance Committee members are independent.
|
| ||
Corporate Governance and the Board of Directors
Committees
As of the date of this filing, the Board has 15 directors and the following seven committees: (1) Audit Committee;
(2) Compensation and Talent Management Committee; (3) Corporate Responsibility and Sustainability Committee;
(4) Executive Committee; (5) Finance Committee; (6) Information Technology Committee; and (7) Nominating and Corporate Governance Committee. Each of the committees operates under a written charter adopted by the Board except the Executive Committee, which operates pursuant to Corning’s by-laws. The committee charters and the by-laws are available on our website at investor.corning.com/investor-relations/governance/overview/default.aspx. Each committee reviews and reassesses the adequacy of its charter annually, conducts annual evaluations of its performance with respect to its duties and responsibilities as laid out in the charter, and reports regularly to the Board with respect to the committee’s activities. Additionally, the Board and each of the committees has the authority to retain outside advisors as the Board and/or each committee deems necessary.
Each committee (other than Executive) is chaired by and entirely composed of independent directors.
Board committee membership is set forth below. “C” denotes Chair of the committee.
Corporate Governance and the Board of Directors
Corning’s Board of Directors met five times in 2022. Its committees and their functions are as follows:
|
| |
|
| |
|
| |
|
Corporate Governance and the Board of Directors
|
| |
|
| |
|
|
Corporate Governance and the Board of Directors
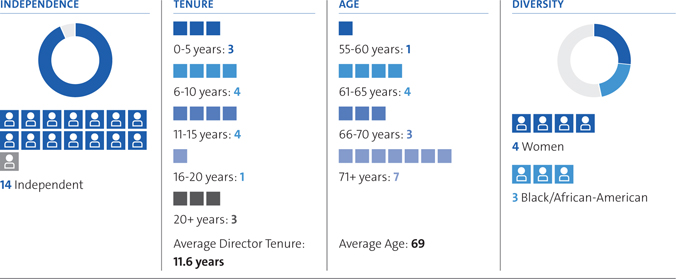
Board Composition
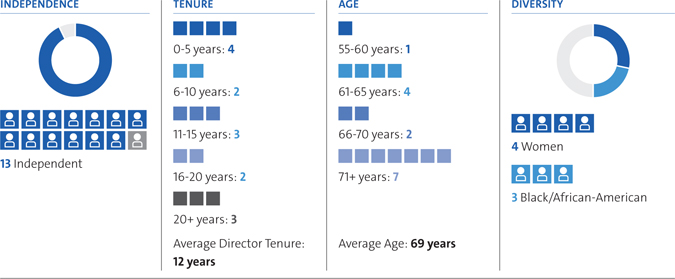
Our Board is responsible for the oversight and success of our Company. We seek to maintain a mix of directors who bring strong leadership, diverse perspectives, a broad range of skills relevant to Corning, and depth of experience to their positions. Our board is high-functioning and engaged. A supermajority of independent directors ensures robust debate and challenged opinions in the boardroom, while diversity of gender, age, race, ethnicity and expertise contributes to a wide range of views. Our Board includes four women, three African-Americans, and four directors who hold science, technology or mathematics Ph.Ds. We also have two decades of age diversity among our directors, with their ages ranging between 56 and 77 years. We also value the broad corporate governance experience of directors who have served on the boards of other public companies, which adds additional rigor to our governance and risk oversight practices.
Board of Directors Snapshot

 | 
 | 
|  | ||||||
Innovation | 10 Risk Oversight | 4 Public Company CEO or C-Suite Experience |  | ||||||
 |  |  |  | ||||||
| 8Finance and M&A | 6 Operations | 7 Corporate Governance & Ethics | 13 Public Company Director Experience |
Refreshed board composition and diverse leadership
| 75% | 29% | 14% | 43% |
| of directors elected in the past five years are diverse | of Committees chaired by women | of Committees chaired by racially/ethnically diverse directors | of Committees chaired by diverse directors |
| 18 | CORNING 2024 PROXY STATEMENT |
Proxy Statement Summary
Governance Highlights
Corning is committed to maintaining strong corporate governance as a critical component of driving sustained shareholder value. The Board of Directors continually monitors emerging best practices in governance to best serve the interests of the Company’s stakeholders.
The following is a brief overview of some of our most notable corporate governance practices and policies: • We contacted holders of approximately 52% of our common stock during the 2023-2024 outreach season to discuss our executive compensation programs and corporate governance practices and engaged with holders of approximately 27% of our common stock on these matters; • We ensure alignment of our corporate governance practices with the Investor Stewardship Group’s corporate governance Principles for U.S. Listed Companies; • Our Board, through its committees, provides direct oversight of ESG risks and issues (see page 31); • We adopted the principles embodied in the Shareholder-Director Exchange (SDX) Protocol; and • We adopted proxy access whereby qualifying shareholders are permitted to include director nominees in the proxy statement. | |
| The Corporate Governance section beginning on page 20 describes our governance framework, which includes the following: | |
✓ Annual election of all directors ✓ Majority vote standard for the election of directors in uncontested elections ✓ Active shareholder engagement, including by directors, to directly gather investor perspectives ✓ Active, engaged and experienced Lead Independent Director ✓ Independent board committees, with all committees (except the Executive Committee) consisting entirely of independent directors ✓ Regular executive sessions of independent directors | ✓ Market-competitive director compensation program designed to support and reinforce our governance principles ✓ Robust stock ownership guidelines for directors and key executive officers ✓ Prohibition on pledging, hedging or trading in derivatives of the Company’s stock for directors and employees ✓ Clawback policy in accordance with NYSE Listing Standards for executive incentive compensation in the event of certain financial restatements |
| CORNING 2024 PROXY STATEMENT | 19 |

Corporate Governance
Our Board of Directors employs practices that foster effective Board oversight of critical matters such as strategy, management succession planning, financial and other controls, risk management and compliance. The Board reviews our major governance policies, practices and processes regularly in the context of current corporate governance trends, investor feedback, regulatory changes and recognized best practices. Corning also aligns its corporate governance practices with the Investor Stewardship Group’s (ISG) Corporate Governance Framework for U.S. Listed Companies.
The following sections provide an overview of our corporate governance structure and processes, including key aspects of our Board operations, and how they align with the ISG Principles.
| Description | |||
| ISG Principle 1: Boards are accountable to shareholders | |||
| Annual election of directors | All directors are elected annually, which reinforces our Board’s accountability to shareholders. | ||
| Majority voting standard for director elections | Our by-laws mandate that directors be elected under a “majority voting” standard in uncontested elections. Each director nominee must receive more votes “For” his or her election than votes “Against” to be elected. | ||
| Proxy access | Eligible shareholders may include their director nominees in our proxy materials. | ||
| No poison pill | Corning does not have a poison pill. | ||
| ISG Principle 2: Shareholders should be entitled to voting rights in proportion to their economic interest | |||
| One-share, One-vote | Corning has one class of voting stock. Each share is entitled to one vote. | ||
| ISG Principle 3: Boards should be responsive to shareholders and be proactive in order to understand their perspectives | |||
| Shareholder engagement | Our investor relations team maintains an ongoing dialogue with investors and portfolio managers year-round on matters of business performance and results. In the 2023-2024 proxy season, we reached out to investors representing approximately 52% of our outstanding shares and engaged with shareholders representing approximately 27% of our shares. Management and directors engage with our largest shareholders’ governance teams on topics such as governance, our strategic priorities, compensation, human capital management and sustainability. | ||
| ISG Principle 4: Boards should have a strong, independent leadership structure | |||
| Lead Independent Director | Our Corporate Governance Guidelines require a Lead Independent Director with specific responsibilities to ensure independent oversight of management whenever our CEO is also the Chair of the Board. As former Chairman, Chief Executive Officer and President of Merck & Co., Inc., our Lead Independent Director, Richard T. Clark, brings deep leadership experience to the role. See page 22. | ||
| Annual Evaluation of Leadership Structure | The Board considers the appropriateness of its leadership structure annually and discloses in the proxy statement why it believes the current structure is appropriate. See page 22. | ||
| 20 | CORNING 2024 PROXY STATEMENT |
Corporate Governance and the Board of Directors
| Practice | Description | ||
| ISG Principle 5: Board should adopt structures and practices that enhance their effectiveness | |||
| Independence | Our Corporate Governance Guidelines require a majority of our directors to be independent. Currently, all directors but one (or 93%) are independent. Except for our Executive Committee, each of our Board committees consists entirely of independent directors. See page 28. | ||
| Skills and qualifications | Our Board is composed of accomplished professionals with deep experiences, skills, and knowledge relevant to our business, resulting in a highly functioning and engaged Board. A matrix of relevant skills can be found on page 38. | ||
| Commitment to Diversity | The Board seeks to achieve diversity among its members and is committed to actively seeking out highly qualified women and minority candidates, as well as candidates with diverse backgrounds, skills and experiences. The Board’s definition of diversity explicitly includes gender and racial/ethnic background. See page 26. | ||
| Director tenure | The current average tenure of members of our Board, excluding our CEO Mr. Weeks and our retiring directors Mr. Blair and Mr. Clark, is 11 years. The Board’s retirement policy requires a director to retire at the annual meeting of shareholders following the director’s 78th birthday. In addition, a director is required to submit an offer of resignation for the Board’s consideration upon any significant change in the director’s principal employment or responsibilities. | ||
| Director overboarding | The Board believes director participation on other public company boards adds additional depth to our governance and risk oversight practices. However, we have a policy to help provide confidence that each of our directors can dedicate the meaningful amount of time necessary to be a highly effective member of the Board. Absent review and approval by the Nominating and Corporate Governance Committee, a non-employee director may serve on no more than three other public company boards and an employee director may serve on no more than two other public company boards. | ||
| Board and committee evaluations | The Board and each committee conduct an annual review of their effectiveness. The Chair of the Nominating and Corporate Governance Committee, as part of the Board evaluation, annually interviews each director and solicits feedback regarding the Board’s composition, performance, effectiveness and areas of focus. From those discussions, the Chair of the Nominating and Corporate Governance Committee reports the results of the evaluation to the full Board, composes a list of action items and follows-up to ensure implementation. See page 26 for more information. | ||
| Meeting attendance | The Board met seven times in 2023. Directors attended 97% of combined total Board and applicable committee meetings in 2023. See page 33. | ||
| ISG Principle 6: Boards should develop management incentive structures that are aligned with the long-term strategy of the company | |||
| Robust stock ownership guidelines | We require robust stock ownership for directors (5x annual cash retainer), CEO (6x base salary), and other NEOs and Senior Leadership Team members (3x base salary). See page 54. | ||
| Shareholder support for executive compensation | Corning’s executive compensation program received 91% shareholder support in 2023 and has averaged 91% shareholder approval over the past three years. | ||
| Committee oversight of executive compensation | The Compensation and Talent Management Committee annually reviews and approves the executive compensation program’s design, goals and objectives for alignment with our business objectives and general compensation strategies. | ||
| Long- and short-term goals drive executive compensation | Our annual and long-term incentive programs are designed to reward financial and operational performance in support of Corning’s strategic priorities, a topic on which management regularly engages shareholders. | ||
| Clear communication of economic drivers of executive compensation | The proxy statement clearly communicates the link between management incentive compensation plans and the Company’s short- and long-term performance. | ||
| CORNING 2024 PROXY STATEMENT | 21 |
Corporate Governance and the Board of Directors
Board Leadership Structure
The Company’s Corporate Governance Guidelines provide the Board with the flexibility to select the appropriate leadership structure for the Company. Annually, the Board must review whether the role of Chairman should be a non-executive position or combined with that of the CEO. In making determinations about the leadership structure, the Board considers many factors, including the specific needs of the business and what is in the best interests of the Company’s shareholders. The current leadership structure comprises a combined Chairman and CEO, a Lead Independent Director, Board committees led primarily by independent directors and active engagement by all directors. The Board believes that this structure provides an effective balance between strong Company leadership and appropriate safeguards and oversight by independent directors.
In February 2024, the Board determined that our combined Chairman and CEO, supported by our Lead Independent Director, continues to provide strong leadership and oversight and ensures effective functioning of management and the Company. The Board believes that having one person serve as Chairman and CEO can provide certain synergies and efficiencies that enhance the functioning of the Board and, importantly, allow it to most effectively execute its role in overseeing business strategy. Mr. Weeks’ vast knowledge of our Company, our diverse products and business lines, our global operations, the nuances of the innovation pipeline and the challenges and opportunities particular to Corning make him uniquely suited to identify many of the business issues that require Board attention. As Chairman, he is best positioned to focus directors’ attention on the most critical business matters.
Richard T. Clark was re-appointed to the role of Lead Independent Director by the independent directors effective February 7, 2024, pursuant to the requirement of our Corporate Governance Guidelines that when the Chairman and CEO roles are combined, the independent directors annually appoint a Lead Independent Director from their membership. Mr. Clark’s understanding of the Company and the industry, his experience on other public boards, and his management expertise as the former Chairman, Chief Executive Officer and President of Merck & Co., Inc. enables him to assure independent board leadership at the Company. The Board is comprised solely of independent directors other than the CEO, and 100 percent of the Audit, Compensation and Talent Management, Corporate Responsibility and Sustainability, Finance, Information Technology and Nominating and Corporate Governance Committee members are independent.
| Duties and Responsibilities | ||||
CHAIRMAN OF THE BOARD • Presides over meetings of the Board. • Presides over meetings of shareholders. • Consults and advises the Board and its committees on the business and affairs of the Company. • Performs such other duties as may be assigned by the Board. CHIEF EXECUTIVE OFFICER • Oversees the affairs of the Company, subject to the overall direction and supervision of the Board and its committees and subject to such powers as reserved by the Board. | LEAD INDEPENDENT DIRECTOR • Presides at all meetings at which the Chair is not present, including executive sessions of the independent directors (which are held at every Board meeting). • Leads the Board’s oversight of Corning’s strategic priorities and critical risk management processes. • Facilitates regular CEO performance reviews and ongoing management succession planning reviews. • Participates in conversations with the Company’s shareholders. • Serves as liaison between the Chair and the independent directors. • Approves Board meeting agendas and schedules. • Approves the type of information to be provided to directors for Board meetings. • Calls meetings of the independent directors when necessary and appropriate. • Performs other duties as the Board may designate. • Meets with the CEO after regularly scheduled Board meetings to provide feedback on the independent directors’ deliberations. • Regularly speaks with the CEO between Board meetings to discuss matters of concern, often following consultation with other independent directors. | |||
| 22 | CORNING 2024 PROXY STATEMENT |
Corporate Governance and the Board of Directors
Committees
As of the date of this filing, the Board has 16 directors and the following seven committees: (1) Audit Committee; (2) Compensation and Talent Management Committee; (3) Corporate Responsibility and Sustainability Committee; (4) Executive Committee; (5) Finance Committee; (6) Information Technology Committee; and (7) Nominating and Corporate Governance Committee. Each of the committees operates under a written charter adopted by the Board except the Executive Committee, which operates pursuant to Corning’s by-laws. The committee charters and the by-laws are available on our website at investor.corning.com/investor-relations/governance/overview/default.aspx. Each committee reviews and reassesses the adequacy of its charter annually, conducts annual evaluations of its performance with respect to its duties and responsibilities as laid out in the charter, and reports regularly to the Board with respect to the committee’s activities. Additionally, the Board and each committee has the authority to retain outside advisors as the Board and/or each committee deems necessary.
Each committee (other than Executive) is chaired by and entirely composed of independent directors.
Board committee membership is set forth below. “C” denotes Chair of the committee.

| CORNING 2024 PROXY STATEMENT | 23 |
Corporate Governance and the Board of Directors
Corning’s Board of Directors met seven times in 2023. Its committees, the number of meetings, and their functions are as follows:
| Committee | Primary Responsibilities | |||
 | Audit(1) Number of Meetings | • Assists the Board of Directors in its oversight of (i) the integrity of Corning’s financial statements, (ii) the independent registered public accounting firm and (iii) Corning’s compliance with legal and regulatory requirements • Approves the appointment of Corning’s independent registered public accounting firm, oversees the firm’s qualifications, independence and performance, and determines the appropriateness of fees for the firm • Reviews the effectiveness of Corning’s internal control over financial reporting, including disclosure controls and procedures • Reviews the results of Corning’s annual audit and quarterly and annual financial statements • Regularly reviews our enterprise risk management program; monitors legal and regulatory risks by regular discussions with management; evaluates potential risks related to accounting, internal control over financial reporting and tax planning | ||
Compensation
| • Establishes Corning’s goals and objectives with respect to executive compensation and talent management strategies • Evaluates the CEO’s performance in light of Corning’s goals and objectives • Recommends to the Board compensation for the CEO and other elected officers and senior executives • Recommends to the Board the compensation arrangements for all directors, elected officers and other key executives • Oversees Corning’s equity compensation plans and makes recommendations to the Board regarding incentive plans • Monitors potential risks related to the design and administration of compensation plans and policies, and benefits and perquisites plans and policies, including performance-based compensation programs, to promote appropriate incentives in line with shareholder interest that do not promote excessive risk-taking |  | ||
Corporate Number of Meetings | • Assists the Board in fulfilling its oversight responsibility by reviewing Corning’s strategies and policies in, and overseeing risks related to, the areas of public relations and reputation, human capital management and employee relations, government and public policy, sustainability and community responsibility. These areas include: - Corning’s sustainability program and environmental responsibilities, including sustainability goals, environmental and social policies and practices, and energy and water management strategies - safety and health policies and practices, compliance, and human capital management matters such as code of conduct, diversity and inclusion, human rights and labor matters - Political and lobbying activities, relationships with significant governmental agencies in the countries in which the Company operates, and political contributions - Corporate identity, investor relations, media relations (including social media), crisis communications, and product liability - Charitable contribution strategies and significant projects undertaken to improve communities within which the Company has significant operations and employment |  | ||
Executive Number of Meetings | •
|
| 24 | CORNING 2024 PROXY STATEMENT |
Corporate Governance and the Board of Directors
| Committee | Primary Responsibilities | |||
Finance Number of Meetings | • Reviews all potential material transactions, including mergers, acquisitions, divestitures and investments in third parties • Reviews capital expenditure plans and capital projects • Monitors Corning’s short- and long-term liquidity • Reviews Corning’s tax position and strategy • Reviews and recommends for approval by the Board declaration of dividends, stock repurchase programs, and short- and long-term financing transactions • Monitors strategic risks related to financial affairs, including capital structure and liquidity risk, transaction execution risk, credit and counterparty risk, market risk, and foreign exchange risk; reviews the policies and strategies for managing financial exposure and contingent liabilities | |||
Information Number of Meetings | • Provides oversight of the Company’s information technology strategy and digital enablement and related investments, including the enterprise resource planning activities • Monitors the effectiveness of, and risks related to, information technology systems; data integrity and protection; information security and cybersecurity programs (which are on the agenda at each Committee meeting); artificial intelligence; disaster recovery capabilities and IT business interruption plans | |||
Nominating and Number of Meetings | • Determines the criteria for selecting and assessing director nominees, identifies individuals qualified to become Board members, reviews candidates recommended by shareholders, and recommends to the Board director nominees to be proposed for election at the annual meeting of shareholders • Monitors significant developments in the regulation and practice of corporate governance • Monitors potential risks related to governance practices by reviewing succession plans and performance evaluations of the Board and CEO, monitoring legal developments and trends regarding corporate governance practices, and evaluating related party transactions • Assists the Board in assessing the independence of directors and reviews transactions between Corning and related persons that are required to be disclosed in our filings with the SEC • Identifies Board members to be assigned to the various committees • Oversees and assists the Board in the review of the Board’s performance • Reviews activities of Board members and senior executives for potential conflicts of interest |
| (1) | The Board of Directors has determined that each member of the Audit Committee satisfies the applicable audit committee independence requirements of the New York Stock Exchange (NYSE) and the SEC. The Board also determined that each member of our Audit Committee is financially literate and Mr. Landgraf, Mr. Blair, Mr. Brun, Dr. Burns, and Ms. Craig are “audit committee financial experts” within the meaning of the applicable SEC rules. |
| (2) | The Board of Directors has determined that each member of the Compensation and Talent Management Committee satisfies the applicable compensation committee independence requirements of the NYSE and the SEC. |
| (3) | The Board of Directors has determined that each member of the Nominating and Corporate Governance Committee satisfies the independence requirements of the NYSE. |
| CORNING 2024 PROXY STATEMENT | 25 |
Corporate Governance and the Board of Directors
Board NominationComposition and Refreshment Process
Our Board is responsible for the oversight and success of our Company. We seek to maintain a mix of directors who bring strong leadership, diverse perspectives, a broad range of skills relevant to Corning, and depth of experience to their positions. A supermajority of independent directors ensures robust debate and challenged opinions in the boardroom, while diversity of gender, age, race, ethnicity and expertise contributes to a wide range of views. Our Board includes four women, three African Americans, and four directors who hold science, technology or mathematics Ph.Ds. We also have two decades of age diversity among our directors, with their ages ranging between 57 and 78 years. We also value the broad corporate governance experience of directors who have served on the boards of other public companies, which adds additional rigor to our governance and risk oversight practices.
When considering Board candidates, the Nominating and Corporate Governance Committee considers those factors most relevant to the Company’s needs, including relevant knowledge and experience, diversity of background, and expertise in areas including business, finance, accounting, science and technology, marketing, manufacturing, strategy, operations, international business, government, corporate governance, information technology, sustainability, cybersecurity and human capital management. The Committee assesses personal qualities of leadership, character, judgment, ethics and reputation; roles and contributions valuable to the business community and the ability to act on behalf of shareholders; whether the candidate is free of conflicts and has the time required for preparation, participation and meeting attendance.
Pursuant to the Company’s published Corporate Governance Guidelines, the
Corporate Governance and the Board of Directors
Committee actively seeks out highly qualified women and minority candidates, as well as candidates with diverse backgrounds, skills and experiences, to include in the pool from which Board nominees are chosen.
The Board conducts an annual evaluation which helps identify skills and experiences to seek in future candidates that would benefit the Company, its stakeholders and the Board. It is the Company’s practice to add new Board members prior to the anticipated retirement of other members of the Board, in order to maintain appropriate Committee sizes and to ensure continuity of leadership and expertise.
How We Evaluate the Board’s Effectiveness
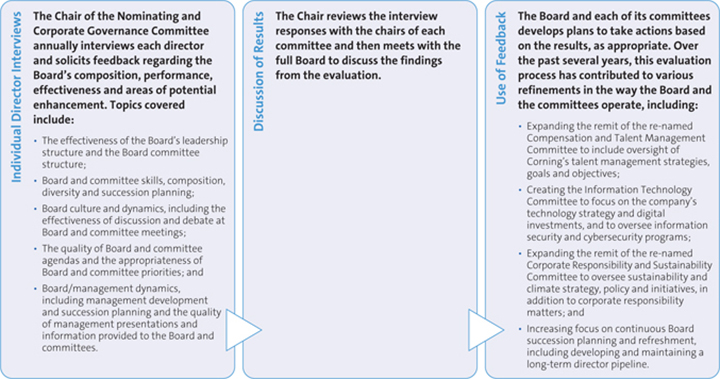
| CORNING 2024 PROXY STATEMENT |
In the case
Corporate Governance Committee will review such directors’ overall service to the Company during their term, including the number of meetings attended, level of participation, quality of performance, and transactions of such directors with the Company, if any, during their term. For those potential new director candidates who appear upon first consideration to meet the Board’s selection criteria, the Nominating and Corporate Governance Committee will conduct appropriate inquiries into their background, qualifications and skills relevant to Corning’s strategic priorities and, depending on the result of such inquiries, arrange for in-person meetings with the potential candidates.
The Nominating and Corporate Governance Committee uses multiple sources for identifying director candidates, including executive search firms, its members’ own contacts, and referrals from other directors, members of management and the Company’s advisors. To maintain a pipeline for new directors, the Nominating and Corporate Governance Committee has retained the executive search firmBoard of Spencer Stuart to help identify director prospects, perform candidate outreach, assist in reference and background checks, and provide other related services on an ongoing basis. Director candidates recommended by shareholders in the manner described on page 108 will be considered in the same manner in which the Nominating and Corporate Governance Committee evaluates candidates recommended by other sources. In addition, our by-laws permit a group of up to 20 shareholders who have owned a minimum of 3% of our outstanding capital stock for at least three years to submit director nominees for up to the greater of two directors or 20% of the board for inclusion in our proxy statement. See “Shareholder Proposals and Director Nominations for the 2024 Annual Meeting” on page 108 of this proxy statement. Directors
The Nominating and Corporate Governance Committee regularly considers the long-term make-up of our Board of Directors and how the composition of our board changes over time. The Nominating and Corporate Governance Committee also considers the skills needed on our board as our business and the markets in which we do business evolve. The Board’s believes that consistent refreshment balances the importance of the institutional knowledge of longer-tenured Board members with a desire for fresh and diverse perspectives. In the last ten years, we have added 76 new independent directors to the Board and 3 directors have retired.
The Nominating and Corporate Governance Committee uses multiple sources for identifying director candidates, including executive search firms, its members’ own contacts, and referrals from other directors, members of management and the Company’s advisors. To maintain a pipeline for new directors, the Nominating and Corporate Governance Committee has retained the executive search firm of Spencer Stuart to help identify director prospects, perform candidate outreach, assist in reference and background checks, and provide other related services on an ongoing basis.
Director candidates recommended by shareholders in the manner described on page 102 will be considered in the same way the Nominating and Corporate Governance Committee evaluates candidates recommended by other sources. In addition, our by-laws permit a group of up to 20 shareholders who have owned a minimum of 3% of our outstanding capital stock for at least three years to submit director nominees for up to the greater of two directors or 20% of the board for inclusion in our proxy statement. See “Shareholder Proposals and have had 5 directors retire.Director Nominations for the 2025 Annual Meeting” on page 102 of this proxy statement.
Director education is vital to the ability of directors to fulfill their roles and supports Board members in their continuous learning. The Board encourages directors to participate annually in external continuing director education programs, and our company reimburses directors for their expenses associated with this participation. For example, Ms. Henretta recently received the Competent Board ESG Certification Program Certificate. All new directors also participate in our director orientation program during their first year on our Board. We also encourage Board members to gain credentials in specialized topics such as sustainability and cybersecurity and we reimburse them for costs associated with this effort.
BOARD COMPOSITION

BOARD OPERATION
| CORNING 2024 PROXY STATEMENT | 27 |
Corporate Governance and the Board of Directors
Management Succession Planning
One of the Board’s primary responsibilities is ensuring that Corning has a high-performing management team in place. The Board oversees management succession planning, with our Lead Independent Director facilitating ongoing review and Board approval of succession and management development plans for the CEO and Senior Leadership Team. The goal of this ongoing process is to maximize the pool of internal candidates able to assume top management positions with minimal business interruption. Recently, succession planning has resulted in the appointment of highly qualified executives in the Chief Financial Officer and Chief Technology Officer roles, both internal candidates, and the Chief Digital and Information Officer anand Chief Human Resources Officer roles, both external candidate.candidates. The Board regularly discusses succession planning for the chief executive officerChief Executive Officer and other senior management positions in executive sessions. The Board has regular engagement with various levels of management at Board and Committee meetings which gives directors additional exposure to the management pipeline.
In 2020, the Board oversaw the reorganization of our operating structure to align management and business teams
around our five Market-Access Platforms. The structure includes a Senior Leadership Team of nineteen senior executives, representing a wealth of skills and knowledge developed over many years of service to the Company, whose leadership will be
Corporate Governance and the Board of Directors
key as Corning continues to navigate the ongoing macroeconomic challenges and prepares for future growth. The Company also seeks highly qualified new executives from outside the Company if and when appropriate. We believe the strength of our management structure and Senior Leadership Team is evident in our performance throughout the pandemic from 2020 through 2022.
Director Independence
Our Board is 93% independent, and such independent oversight bolsters our success. Our Board has determined that each of our non-employee directors qualifies as “independent” in accordance with the listing requirements of the NYSE, applicable SEC rules and the Company’s director qualification standards. Mr. Weeks is not independent because he is an executive officer of Corning.
The NYSE listing requirements state that no director may be qualified as “independent” unless our Board affirmatively determines that the director has no material relationship with Corning. When making independence determinations, the Board considers all relevant facts and circumstances which might bar a director from being determined to be “independent,” including the NYSE criteria.
Our Corporate Governance Guidelines require the Board to make an annual determination regarding the independence of each of our directors. In making its independence determinations, the Board considered transactions, if any, that occurred since the beginning of 20202021 between Corning and entities associated with our independent directors or members of their immediate family. The Board also reviewed information with regard toabout each director’s business and personal activities as they may relate to Corning and Corning’s management. It considered that each of Ms. Henretta, Messrs. Martin, Brun and Ferguson, and Drs. Huttenlocher and Wrighton and Ms. Henretta are or were, during the previous three years, an employee, partner or affiliate of a company or organization that had a business relationship with Corning at some time during those years. The Board also considered: that Corning’s business relationships with each such company or organization were ordinary course/arm’s length dealings; no Corning director had a personal interest in, or received a personal benefit from, such relationships; any payments or contributions to or from each of these entities constituted less than the greater of $1 million, or 2% of such entity’s consolidated gross revenues in each of those years; that such relationships arose only from such director’s position as an employee, partner or affiliate of the relevant company with which Corning does business; that such director has no input or direct or indirect material interest in any of the business relationships or transactions; that such director had no role or financial interest in any decisions about any of these relationships or transactions; and that such a relationship does not bar independence under the NYSE listing requirements, applicable SEC rules or Corning’s director qualification standards.
Based on all of the relevant facts and circumstances, the Board concluded that none of the director relationships mentioned above constituted a material relationship with Corning that represents a potential conflict of interest, or otherwise interferes with the exercise by any of these directors of his or her independent judgment with respect to Corning.
Policy on Transactions with Related Persons
The Board of Directors has a written policy requiring the full Board or a designated Board committee to pre-approve any transaction involving Corning in which one of our directors, nominees for director, executive officers, or greater than 5% shareholders, or their immediate family members, have a direct or indirect material interest and where the amount involved exceeds $120,000 in any fiscal year. As set forth in the Corporate Governance Guidelines, the Board has delegated to the Nominating and Corporate Governance Committee the responsibility for reviewing and approving any such transactions.
In determining whether to approve any such transaction, the Board or relevant committee must consider, in addition to other factors deemed appropriate, whether the transaction is on terms no less favorable to Corning than transactions involving unrelated parties. No director may participate in any review or approval of any transaction if he or she, or his or her immediate family member, has a direct or indirect material interest in the transaction.
| 28 | CORNING 2024 PROXY STATEMENT |
No related party transactions occurred
Corporate Governance and the Board of Directors
Stephen M. Bell, an engineering supervisor at Corning’s facility in 2022 that required disclosure under this policy or under relevant SEC rules.Newton, North Carolina, is the son of Michael A. Bell, an executive officer of Corning. In 2023, Corning paid Stephen M. Bell $134,489 and bonus amounts of $14,168. The Nominating and Corporate Governance Committee reviewed and approved Mr. Bell’s employment in accordance with Corning’s Policy on Transactions with Related Persons.
Compensation and Talent Management Committee Interlocks
and Insider Participation
Dr. Rieman and Messrs. Brun, Clark, Ferguson, Landgraf and Tookes served on the Compensation and Talent Management Committee during 2022.2023. No member of the Compensation and Talent Management Committee that served during 20222023 is now, or has ever been, an officer or employee of Corning. No member of the Compensation and Talent Management Committee had any relationship with Corning or any of its subsidiaries during 20222023 pursuant to which disclosure would be required under applicable rules of the SEC pertaining to the disclosure of transactions with related persons. No Corning executive officer currently serves
Corporate Governance and the Board of Directors
or served during 20222023 on the board of directors or compensation committee of another company at any time during which an executive officer of such other company served on Corning’s Board or Compensation and Talent Management Committee.
Risk Oversight
Inherent in the Board’s responsibilities is anthe understanding of and oversight overof the various risks facing the Company. The Board does not view risk in isolation: risks are considered in virtually every business decision. The Board recognizes that it is neither possible nor prudent to eliminate all risk; indeed, purposeful and appropriate risk taking is essential for the Company to be competitive on a global basis and to achieve the Company’s long-term strategic objectives.
Effective risk oversight is of critical importance to our Board. The Board has implemented a risk governance framework designed to:
| • | understand critical risks in the Company’s business and strategy; |
| • | allocate responsibilities for risk oversight among the full Board and its committees; |
| • | evaluate the Company’s risk management processes and whether they are functioning adequately; |
| • | facilitate open communication between management and Directors; and |
| • | foster an appropriate culture of integrity and risk awareness. |
To learn more about risks facing the Company, you can review Part I, “Item 1A. Risk Factors” in the Form 10-K. The risks described in the Form 10-K are not the only risks facing the Company. Additional risks and uncertainties not currently known or that may currently be deemed to be immaterial based on the information known to the Company also may materially adversely affect the Company’s business, financial condition or results of operations in future periods.
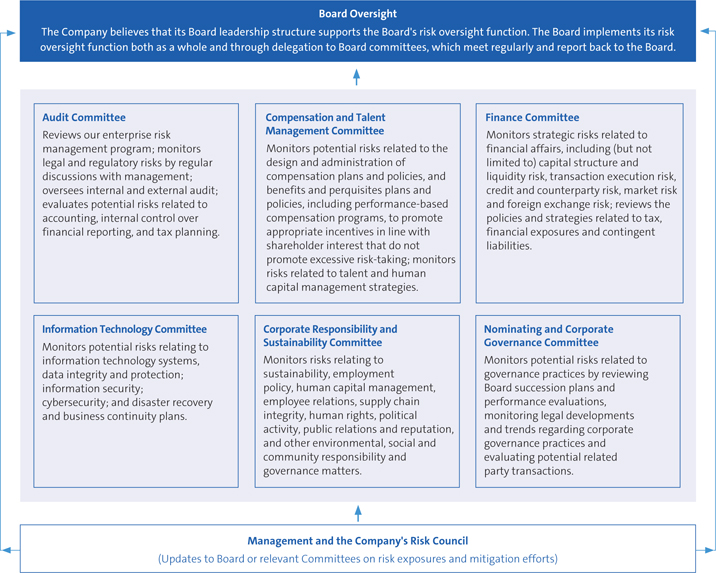
Corporate Governance and the Board of Directors
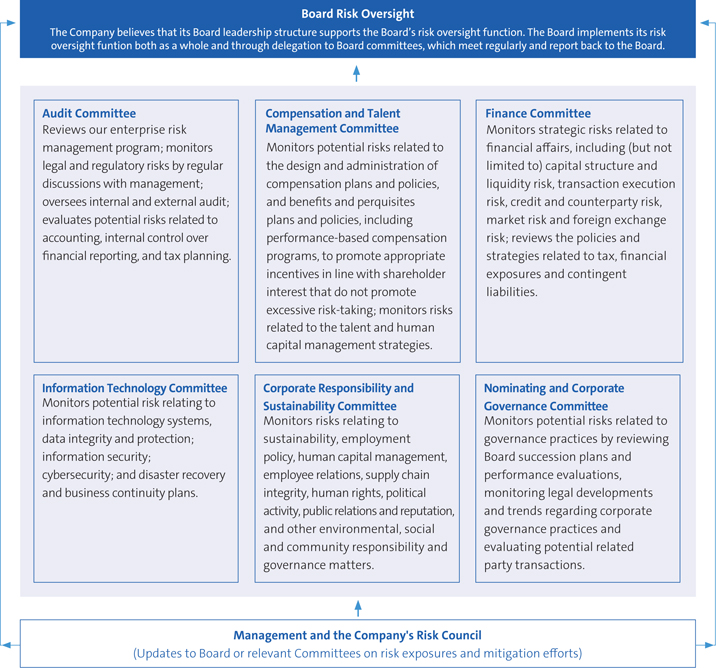
Risks associated with current business status or strategic alternatives are subjected to analysis, discussion and deliberation by management and the Board. Operationally, management reports periodically to the Board on the Company’s enterprise risk management (ERM) policies and procedures, and to the Audit, Information Technology, Finance, and Corporate Responsibility and Sustainability Committees on our top risks and compliance policies and practices. Management also provides a comprehensive annual report of top risks to the Board. The Chief Compliance Officer reports to the Audit Committee at each of its meetings on any relevant compliance issues, and annually presents an overview of the Company’s compliance function, processes and effectiveness.
Corning’s ERM program utilizes (1) a Risk Council chaired by the Executive Vice President and Chief Financial Officer and composed of Corning management and staff to aggregate, prioritize and assess risks, including strategic, financial, operational, business, reputational, governance and managerial risks; (2) an internal audit department; and (3) a Compliance Council, which reports regularly to each of the Audit Committee and Corporate Responsibility and Sustainability Committee and reviews the Company’s compliance with laws and regulations of the countries in which we conduct business as well as disclosures made by the Company about relevant risks.
| 30 | CORNING 2024 PROXY STATEMENT |
Corporate Governance and the Board of Directors
The Board believes that the work undertaken by the committees of the Board, together with the work of the full Board and the Company’s management, enables the Board to effectively oversee Corning’s management of risk.
Investing in Risk Management
Positioned to Adapt to Challenging Environments
effectively to challenging operating environments and market fluctuations |
|  |
|  |
|  |
Corporate Governance and the Board of Directors
Environmental, Social and Governance (ESG) Oversight
We have integrated corporate responsibilityESG throughout our business, from our daily operations and our risk management processes to our executive leadership and our Board. In doing so, we follow guidance provided by the Committee of Sponsoring Organizations of the Treadway Commission and the World Business Council for Sustainable Development. We also leverage the framework of the Task Force for Climate-Related Financial Disclosures (TCFD) to assess and report on climate risks and opportunities for Corning. The Board believes that identifying risks and opportunities relating to sustainability is essential to the long-term viability of our Company and to deliver long-term value to shareholders. With respect to Board oversight of ESG matters, rather than concentrating all ESG matters into a single Committee, the Board believes each Committee should maintain oversight over the particular matters that fall within its scope. The appropriate Committees then report to the Board as appropriate. For example:
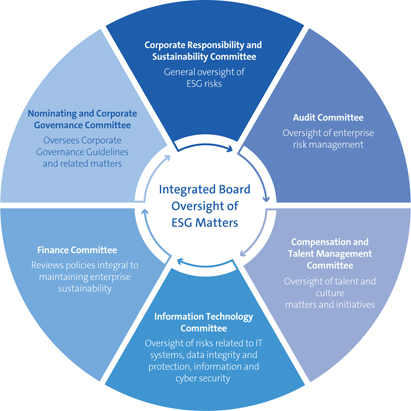
Using this approach, members of each committee are able tocan leverage their specific subject-matter expertise to oversee and advise the Board on the matters most relevant to their committee’s area of responsibility. In some circumstances, such as the efforts related to our Office of Racial Equity and Social Unity, Board members participate directly in working groups with management. Operating as an integrated whole, our Board is best positioned to manage the ESG risks and issues most impactful to our enterprise and our communities.
Cybersecurity Oversight
Corning recognizes that cyberCorning’s Board plays a role in overseeing risks are enterprise-wide and management issues forassociated with cybersecurity threats. In particular, the Board of Directors to oversee. The Information Technology (IT)IT Committee of the Board is responsible for cybersecurity governance and has information security oversight as a key component of its charter and incharter. In all meetings, itthe IT Committee reviews corporate actions taken to improve the Company’s cybersecurity posture as well as cyber incidents, if any. Briefings to the Information Technology Committee are presented byany significant cybersecurity events. Corning’s Chief Digital and Information Officer (CDIO), in combination with ourCorning’s Chief Information Security Officer who review both quarterly activity(CISO), briefs the IT Committee on cybersecurity activities and long-term cybersecurity strategies, of the Company, as well as general
| CORNING 2024 PROXY STATEMENT | 31 |
Corporate Governance and the Board of Directors
cybersecurity trends for possiblethat could have a material impact on the Company. Moreover, onOn an annual basis, the Chief Information Security OfficerCISO provides ana cybersecurity update on cybersecurity matters to the full Board as well as presents toand participates in a joint meeting of the IT and Audit Committees to review significant cybersecurity risks to the Company.and their impact, if any, on internal controls. At these meetings, theany time, Board members may raise any concerns it may have regarding the Company’s cybersecurity posture and recommend any future changes to controls or procedures. All IT Committee and joint IT/Audit committee meetings are summarized to the full Board with any significant cybersecurity issues being addressed as appropriate. Should a cybercybersecurity incident rise to the level of a corporate crisis, consistent with the Company’s corporate crisis response escalation protocols, the Board would be engaged.
Corporate Governance and the Board of Directors
Assessment of Company Culture
Our directors are positioned to assess Company culture in a number ofmany ways. The Company’s Senior Leadership Team attends Board meetings, and numerous other members of management attend Board committee meetings. Formal dinners and informal lunches with meeting attendees provide DirectorsDirectors’ insight tointo how our teams function. When presenting an issue relevant to the Board, full business and technology teams attend to answer the Directors’ questions and to join them at these dinners and lunches. The Board visits our research campus to meet with dozens of employees working on our key innovation initiatives and/orand participates in a technology showcase on an annual basis,annually, where our newest initiatives are highlighted and discussed. If the Board is unable to visit our research campus in person, virtual Technology Showcases are held where senior innovators demonstrate those products and innovations in the Company’s commercialization pipeline. The Board also meets at different Corning locations – occasionally internationally – to see our manufacturing facilities, meet local managers and employees and explore the Company’s culture.
Compensation Risk Analysis
| Corning does not use compensation policies or practices that create risks that are likely to have a material adverse effect on the Company. |
In February 2023,2024, the Compensation and Talent Management Committee reviewed the conclusions of a risk assessment of ourthat it had instructed Frederic W. Cook & Co., Inc. to undertake regarding the Company’s compensation policies and practices covering all employees. This type of assessment is conducted annually by a cross-functional team with representatives from Human Resources (Compensation and Benefits), Law and Finance. The Compensation and Talent Management Committee evaluated the levels of risk-taking that potentially could be encouraged by our compensation arrangements, considering the arrangements’ risk-mitigation features, to determine whether they are appropriate in the context of our strategic plan and annual budget, our overall compensation arrangements, our compensation objectives, and Corning’s overall risk profile. Identified risk-mitigation features included the following:
| • | The mix of cash and equity pay-outs tied to both short-term financial performance, mid-term financial performance, and long-term value creation; |
| • | The time vesting requirements in our long-term incentive plans, which help align the interests of employees to shareholders; |
| • | The use of multiple financial performance metrics that are readily monitored and reviewed, and aligned with the corporate and business unit objectives; |
| • | The rigorous budget and goal-setting processes that involve both top-down and bottom-up analyses; |
| • | The use of common performance metrics for incentives across Corning’s management team and all eligible employees with corporate results impacting the compensation of all Corning employees; |
| • | Internal advisory committees and plan caps that are intended to avoid imprudent risk-taking; |
| • | Our robust stock ownership, clawback, anti-hedging and anti-pledging policies for NEOs and other employees; |
| • | Multiple levels of review and approval of awards, including Committee approval of all officer and equity compensation; and |
| • | Immediate oversight of executive pay matters in mergers and acquisitions and unit compensation plans throughout the acquisition integration process. |
The Compensation and Talent Management Committee concluded that Corning’s executive compensation program is balanced and does not reward excessive financial risk-taking.
| 32 | CORNING |
Corporate Governance and the Board of Directors
Board and Shareholder Meeting Attendance
The Board of Directors met fiveseven times during 2022.in 2023. Attendance at Board and committee meetings averaged 99.7%97% in 2022,2023, and each incumbent director attended no less than 95%86% of the meetings of the Board and committees on which the director served.
The Board has a policy requiring all directors to attend our Annual Meeting, absent extraordinary circumstances. All of our directors attended our 20222023 Annual Meeting of Shareholders.
Ethics and Conduct
We are committed to conducting business lawfully and ethically. Our directors, executive officers, and all Corning employees are required tomust act at all times with honesty and integrity. We have a comprehensive Code of Conduct that applies to all Corning directors and employees that covers areas of professional conduct, including conflicts of interest, the protection of corporate opportunities and assets, employment policies, non-discrimination policies, confidentiality, vendor standards, and intellectual property, and requires strict adherence to all laws and regulations applicable to our business. Furthermore, our Code of Ethics for our Chief Executive Officer and Financial Executives requires business integrity, avoidance of conflicts of interest, and transparency. Our Board spends meaningful time with executive management at board meetings, and other members of management at other board events, where the relationships developed enable the Board to ensure that the Company maintains a culture of integrity, responsibility and accountability throughout the organization.
We also have a supplemental “Code of Conduct for Directors and Executive Officers” that includes policies calling for strict observance of all laws applicable to our business, requires directors and executive officers to avoid any conflict between their personal interests and the interests of the Company in dealing with suppliers, customers, and other third parties, and imposes standards upon certain conduct in their personal affairs, including transactions in securities of the Company, any Company affiliate, or any unaffiliated organization. Each director and executive officer is expected to be familiar with and to follow these policies to the extent applicable to them. Any employee can provide an anonymous report of an actual or apparent violation of our codes of conduct. We will disclose any future amendments to, or waivers from, any provision of our codes of conduct involving our directors, our principal executive officer, principal financial officer, principal accounting officer, controller or other persons performing similar functions on our website within four business days following the date of any such amendment or waiver. No such waivers were sought or granted in 2022.2023.
Lobbying and Political Contributions Policy
Corning encourages employees to participate in the political process on a personal basis. However, any use of Corning funds, property, resources or employee work time for U.S. political purposes — for example, to any U.S. political party, candidate or government official – is subject to Corning’s Lobbying and Political Contributions Policy and must be approved in advance by Corning’s Government Affairs office. Any contact with members of the U.S. Congress or executive branch officials on behalf of Corning, or any Corning contribution to U.S. government officials or payment related to these officials, must be approved by and coordinated through Corning’s Government Affairs office. Our policy can be found at investor.corning.com/investor-relations/governance/political-contributions/default.aspx.
Communications with Directors
Shareholders and interested parties may communicate concerns to any director, committee member or the Board by writing to the following address: Corning Incorporated Board of Directors, Corning Incorporated, One Riverfront Plaza, Corning, New York 14831, Attention: Corporate Secretary. Please specify to whom your correspondence should be directed. The Board has instructed our Corporate Secretary to review correspondence directed to the Board and, at the Corporate Secretary’s discretion, to forward items that are appropriate for the Board’s consideration.
Corporate Governance and the Board of Directors
Corporate Governance Materials Available
on Corning’s Website
In addition to our Corporate Governance Guidelines and Director Qualification Standards, other information relating to Corning’s corporate governance is available on the Investor Relations – Governance – Downloads section of our website at investor.corning.com/investor-relations/governance/overview/default.aspxincluding:
| • | Corporate Governance Guidelines with Director Qualification Standards |
| • | Corning Incorporated By-Laws |
| • | Political Contributions and Lobbying Policy |
| • |
| • | Code of Conduct for Directors and Executive Officers |
| • | Code of Ethics for Chief Executive Officer and Financial Executives |
| • | Our Code of Conduct |
| • | Audit Committee Charter |
| • | Compensation and Talent Management Committee Charter |
| • | Corporate Responsibility and Sustainability Committee Charter |
| • | Finance Committee Charter |
| • | Information Technology Committee Charter |
| • | Nominating and Corporate Governance Committee Charter |
| 34 | CORNING |


Board of Directors’ Qualifications and Experience
Our Board comprises accomplished professionals with diverse skills and areas of expertise. The broad range of knowledge and opinions represented on our Board is one of its core strengths. Moreover, we believe our directors’ wide range of professional experiences, backgrounds and education provides significant value to the Company, and we intend to continue leveraging this strength.
Mr. Clark will retire from Corning’s Board at the 2024 Annual Meeting after twelve years of service. In January 2024, Mr. Blair advised the Board that he would not stand for re-election.
The following table describes key competencies and skills of our directors who are standing for re-election.
All directors other than Mr. Weeks are independent. Mr. Clark is the Lead Independent Director.Director through the 2024 Annual Meeting of Shareholders. The Board will appoint its new Lead Independent Director in May.
Proposal 1 Election of Directors
What skills and characteristics are currently represented
on the Board?
The Nominating and Corporate Governance Committee determined that the skills listed below are inextricably linked to proper Board oversight of the Company. The Board Skills and Composition Matrix, which follows the chart below, sets forth which Directors have considerable or extensive experience in each of these necessary skill areas.
| Skill | Description of the Skill and Explanation of Its Importance to Our Board |
| Directors who have served on other public company boards can offer perspectives on board dynamics and operations, relations between the board and management, and oversight of matters that are vital to long-term shareholder value creation including corporate governance, executive compensation, risk management, shareholder relations, management and board succession planning and strategic, operational and compliance matters. |
 | Corning is committed to strong financial discipline, effective allocation of capital, and an appropriate capital structure. The Company’s business is multi-faceted and involves complex financial transactions, including mergers and acquisitions, in many countries and in many currencies. We believe that directors who have senior financial leadership experience at large global organizations and financial institutions, and directors who are experienced allocators of investment capital, are important to Corning’s success. |
| Corning considers risk management and risk oversight experience |
| As a public company, Corning is subject to certain auditing, financial accounting, and financial reporting requirements. The Board, particularly through its Audit Committee, is responsible for reviewing Corning’s complex financial statements and disclosures, overseeing financial reporting and internal controls, and monitoring internal and external auditors. Directors who understand financial reporting and the auditing process are important to ensuring that Corning’s achieves accuracy and transparency in its public disclosures. |
 | The Board is responsible for shaping the Company’s corporate governance priorities and structure, which must be transparent and responsive to our shareholders. Because corporate governance affects |
| Corning’s business requires compliance with |
| 36 | CORNING |
Proposal 1 Election of Directors
| Skill | Description of the Skill and Explanation of Its Importance to Our Board |
| When properly structured, executive compensation and benefits |
| Corning’s business thesis can be simplified to “Invent. Make. Sell.” Operations are integral to the manufacturing of our products and efficient management of the enterprise. Corning values board members who are knowledgeable about and possess experience in operations and supply chain management, and the risks inherent in both, so that the Board can oversee our efforts to improve our processes and products. |
| Directors who understand how to strategically plan for the future of the Company, in both the short- and long-term, are better able to oversee and advise management with respect to the formulation and execution of the Company’s strategic plans and their connection to long-term value. |
| A robust cybersecurity environment is critical to protecting Corning’s technology infrastructure, intellectual property, manufacturing and operations, customer and employee information, and integrity as a modern global business. Corning believes its Board should contain directors with experience in information technology and establishing or overseeing information/cyber security systems and protocols. |
| At Corning, our growth is fueled by a commitment to innovation. We succeed through sustained investment in research, development, and engineering, a unique combination of material and process innovation, and close collaboration with customers to solve tough technology challenges. Corning values directors who understand the business of technology and have experience driving innovation and product development. In addition, Corning believes that artificial intelligence (AI) carries opportunities and risks for the Corporation and the world; directors with an understanding of artificial intelligence will enable the Board to make informed strategic decisions, manage risks and navigate the ethical and regulatory considerations associated with the adoption of AI technologies. |
| Corning seeks directors with experience in industries that utilize specialty glass, ceramics, and related materials and technologies, including telecommunications, consumer electronics, display technologies, life sciences, automotive, and others. This experience is critical to the oversight of Corning’s businesses and strategies in these unique and |
Proposal 1 Election of Directors
Board Skills and Composition Matrix
![]()
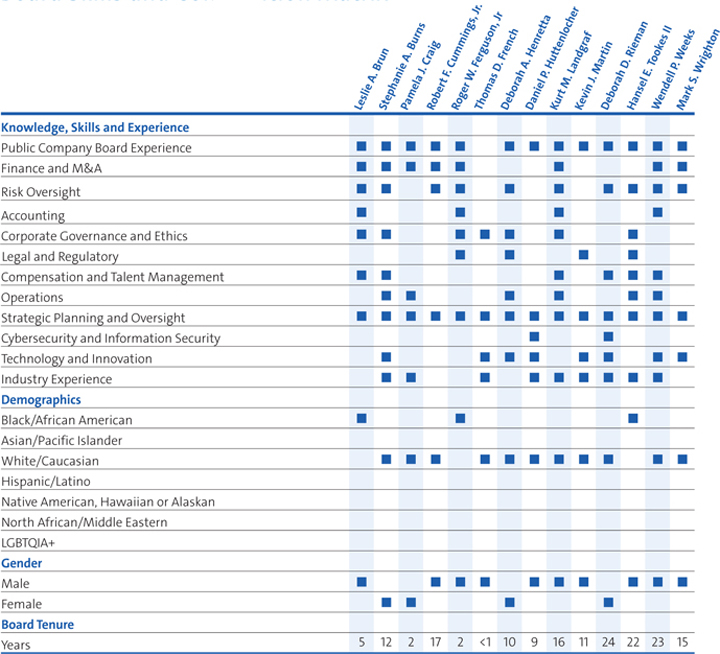
After considering the recommendations of the Nominating and Corporate Governance Committee, the Board has nominated the persons described below to stand for election. All of the nominees were elected by Corning’s shareholders at the 20222023 Annual Meeting. All of the nominees have consented to being named in this proxy statement and to serve as director if elected or re-elected.reelected. The Board believes that each of these nominees is qualified to serve as a director of Corning in light ofconsidering their respective skills and qualifications, as further described below. Equally important, the Board believes this combination of backgrounds, skills and experiences creates a Board that is well-equipped to exercise oversight responsibilities for Corning’s shareholders and other stakeholders.
If elected by our shareholders, the fifteenfourteen director nominees will serve for a one-year term expiring at our 20242025 Annual Meeting of Shareholders. Each director will hold office until his or her successor has been elected and qualified or until the director’s earlier resignation or removal.
 | FOR | Our Board unanimously recommends that shareholders vote FOR all of our director nominees. |
| 38 | CORNING |
Proposal 1 Election of Directors
Corning’s Director Nominees
 |
| ||||||||||
| |||||||||||
| |||||||||||
| |||||||||||
 | Board Experience |  | and M&A |  | |||||||
 |  | ||||||||||
 | Leslie A. Brun Director Since 2018. Age Chairman and Chief Executive Officer, Sarr Group LLC Mr. Brun is chairman and chief executive officer of Sarr Group, LLC, co-founder, chairman and chief executive officer of Ariel Alternatives, LLC, senior advisor of G100, Council Advisors, World 50 and a member of the Council on Foreign Relations. He is also the founder and former chief executive officer and chairman of Hamilton Lane, where he served as chief executive officer and chairman from 1991 until 2005, former lead director of Merck & Co., Inc., former director and chairman of the board of Automatic Data Processing, Inc., former non-executive chairman of CDK Global, Inc., and a former director of Hewlett Packard Enterprise Company. In addition, Mr. Brun also served as a managing director and co-founder of the investment banking group of Fidelity Bank, and as a past vice president in the corporate finance division of E.F. Hutton & Co. Experience, Skills and Qualifications of Particular Relevance to Corning: As the current and former chief executive officer of Top Skills Brought to Our Board | |||||||||||
Committees
•Audit • Compensation | ||||||||||||
Current Public and
•Broadridge Financial | ||||||||||||
Public and Investment •
•
| ||||||||||||
| ||||||||||||
 | Public Company |  | Finance and M&A |  | Risk Oversight | |||||||
 | Accounting |   | Corporate Governance and Ethics |   | Compensation and Talent Management | |||||||
  | Strategic Planning and Oversight |  | ||||||||||
Proposal 1 Election of Directors
  | Stephanie A. Burns Director Since 2012. Age Retired Chairman and Chief Executive Officer, Dow Corning Corporation Dr. Burns has nearly Experience, Skills and Qualifications of Particular Relevance to Corning: As the former chief executive officer of a major chemical company, Dr. Burns brings to Corning’s Board broad expertise in global innovation, directing scientific research, manufacturing and commercial management, and science and technology leadership. Reflecting the deep technical skills related to her Ph.D. in organic chemistry, and as the past honorary president of the Society of Chemical Industry, chair of the American Chemistry Council and member of President Obama’s President’s Export Council, Dr. Burns brings the perspectives of a leader in scientific innovation to the Board. Her background in organic chemistry and experience in managing the impacts of manufacturing on the environment, understanding of the effective management and disclosure of environmental, social and governance (ESG) risks and opportunities, and her educated perspective on corporate sustainability practices ensure the appropriate oversight of ESG at Corning and enable the driving of long-term value for stakeholders. Top Skills Brought to Our Board | |||||||||||
Committees • Audit • Corporate Responsibility | ||||||||||||
Current Public and • HP Inc. • Kellanova (formerly Kellogg Company) | ||||||||||||
Public and Investment • None | ||||||||||||
| Public Company Board Experience | | Finance and M&A | | Risk Oversight | |||||||
| Corporate Governance and Ethics | | Compensation and Talent Management |  | Operations | |||||||
| Strategic Planning and Oversight |  | Technology and Innovation |  | Industry Experience | |||||||
 | ||||||||||
Committees • Audit •Corporate Responsibility | ||||||||||
Current Public and • • | ||||||||||
Public and Investment • • Akamai Technologies, Inc. | ||||||||||
| Board Experience | | | |||||||
| | | ||||||||
| and Oversight |  | | |||||||
Proposal 1 Election of Directors
 |
| |||||||||||||
| ||||||||||||||
| ||||||||||||||
| ||||||||||||||
| Board Experience | | | |||||||||||
 | | | ||||||||||||
| and Oversight | | ||||||||||||
 | Pamela J. Craig Director Since 2021. Age Retired Chief Financial Officer, Accenture plc. From 2006 through 2013, Ms. Craig served as chief financial officer of Accenture plc., a global management consulting, technology services and outsourcing company, following many other leadership roles in line management, consulting and operations during her 34 years with the company. She is also actively involved in charitable organizations focused on education and on the advancement of women in business, including The Women’s Forum of New York, New York University Stern School of Business, Junior Achievement of New Jersey, and is a member of the Board of Trustees of Smith College. Experience, Skills and Qualifications of Particular Relevance to Corning: Ms. Craig brings to Corning’s Board over 34 years of finance, management, operational, technology and international business expertise from her time as chief financial officer at Accenture. Her skills and experience as the CFO of Accenture are particularly relevant to the perspective she brings to the Audit Committee. In particular, she brings knowledge of business transformations, mergers and acquisitions, strategic planning and business process improvement. She also brings broad oversight and strategic skills from her time on the boards of several large, global public companies. Top Skills Brought to Our Board | ||||||||||
| Public Company Board Experience | | Finance and M&A | | Operations | ||||||
| Strategic Planning and Oversight | | Industry Experience | ||||||||
| 40 | CORNING 2024 PROXY STATEMENT |
Proposal 1 Election of Directors
 | ||||||||
Committees • • Finance (Chair) • Nominating and Corporate | ||||||||
Current Public and •
| ||||||||
Public and Investment • | ||||||||
| Experience | | M&A | | ||||
| and Oversight | | Experience | |||||
Proposal 1 Election of Directors
 | |||||||||||
Robert F. Cummings, Jr. Director Since 2006. Age Retired Vice Chairman of Investment Banking, JPMorgan Chase & Co. Mr. Cummings retired as vice chairman of Investment Banking at JPMorgan Chase & Experience, Skills and Qualifications of Particular Relevance to Corning: Mr. | |||||||||||
Top Skills Brought to Our Board | |||||||||||
| |||||||||||
| |||||||||||
| |||||||||||
| Public Company Board | | Finance and | | Risk Oversight | ||||||
| Strategic Planning and Oversight | ||||||||||
| CORNING |
Proposal 1 Election of Directors
 | |||
 | |||
Committees • Nominating and Corporate Governance • Compensation | |||
Current Public and • Alphabet, Inc. • International Flavors & Fragrances, Inc. | |||
Public and Investment Company Directorships Held During the Past 5 Years • General Mills, Inc. • Blend Labs, Inc. | |||
Roger W. Ferguson, Jr. Director Since 2021. Age
Mr. Ferguson Mr. Ferguson has been a national leader in banking and financial services for over 20 years as the former President and Chief Executive Officer of a Fortune 100 Mr. Ferguson is a member of the Smithsonian Institution’s Board of Regents and the American Academy of Arts & Sciences. He also serves on the boards of Experience, Skills and Qualifications of Particular Relevance to Corning: Mr. Ferguson’s extensive background in economics and complex regulatory matters, and distinguished career as a financial services executive, enables him to provide invaluable insight to the Board in an evolving economic, regulatory and asset management industry landscape. In addition, his extensive experience as a public company director has afforded him the ability to gain a well-informed understanding of key corporate governance and executive compensation matters. | |||||||
| Top Skills Brought to Our Board | |||||||
| Public Company Board Experience | | Finance and M&A | | Risk Oversight | ||
| Accounting | | Corporate Governance and Ethics |  | Legal and Regulatory | ||
| Strategic Planning and Oversight | ||||||
| 42 | CORNING 2024 PROXY STATEMENT |
Proposal 1 Election of Directors
 | ||||
Committees • • | ||||
Current Public and •
| ||||
Public and Investment • | ||||
Thomas D. French Director Since 2023. Age 64. Senior Partner Emeritus, McKinsey & Company, Inc.
Experience, Skills and Qualifications of Particular Relevance to Corning: Mr. French brings four decades of management consulting experience to the Board. In particular, he brings deep familiarity with how global, technology-driven companies approach strategic planning, digital transformation, customer engagement, organization design, innovation, and matters of governance. He is also deeply versed in the dynamics of Corning’s end markets, including telecommunications, display glass, advanced materials, and consumer electronics. In his role leading McKinsey’s Marketing and Sales Practice, he gained unique insight into how innovation-driven industrial companies commercialize new technologies and build businesses. | ||||||||||
| Top Skills Brought to Our Board | ||||||||||
| Corporate Governance and Ethics | | Strategic Planning and Oversight | |||||||
| Technology and Innovation | | Industry Experience | |||||||
| Experience | | M&A | | ||||||
| | and Ethics | | |||||||
| and Oversight | |||||||||
Proposal 1 Election of Directors
  | Deborah A. Henretta Director Since 2013. Age Retired Group President of Global E-Business, Procter & Gamble Company Ms. Henretta has Ms. Henretta was a member of Singapore’s Economic Development Board (EDB) from 2007 to 2013. In 2008, she received a U.S. State Department appointment to the Asia-Pacific Economic Cooperation’s Business Advisory Council, becoming the first woman to hold the position. In that role, she advised top government officials, including former President Barack Obama and former Secretary of State Hillary Clinton. She is a senior advisor to G100, partner of Council Advisors, and spearheads SSA & Company’s digital transformation practice. Experience, Skills and Qualifications of Particular Relevance to Corning: Ms. Henretta brings to the board her extensive experience in transformative and inclusive leadership, global operations, government relations, brand building, marketing, emerging markets management, governance and ESG matters from her time as the Group President of Procter & Gamble’s Global E-Businesses, her numerous government appointments, and her ongoing development of corporate leaders and board members through the G100 and Council Advisors. She also brings to the Board a broad knowledge of the issues currently facing public companies, in particular the process of digital transformation, through her experience on the boards of other public companies and her current work with SSA & Company. Ms. Henretta also received ESG Certification from Competent Board. | |||||||||||
Committees • Corporate Responsibility • Information Technology | ||||||||||||
Current Public and • American Eagle • Meritage Homes • NiSource, Inc. | ||||||||||||
Public and Investment • None | ||||||||||||
| Top Skills Brought to Our Board | ||||||||||||
| Public Company Board Experience | | Risk Oversight | | Corporate Governance and Ethics | |||||||
| Legal and Regulatory | | Operations | | Strategic Planning and Oversight | |||||||
| Technology and Innovation | |||||||||||
| 44 | CORNING 2024 PROXY STATEMENT |
Proposal 1 Election of Directors
 | ||||||||||
Committees • • Information Technology | ||||||||||
Current Public and •
| ||||||||||
Public and Investment • None | ||||||||||
| Experience | | | and Ethics | ||||||
| | | and Oversight | |||||||
| ||||||||||
Proposal 1 Election of Directors
 | Daniel P. Huttenlocher Director Since 2015. Age Dean, MIT Stephen A. Schwarzman College of Computing Dr. Huttenlocher is the Dean of the MIT Schwarzman College of Computing. Prior to joining MIT, Dr. Huttenlocher served as dean and vice provost of Cornell Tech from 2012 to 2019 and worked for Cornell University from 1988 to 2012 in various positions. Before Cornell, Dr. Huttenlocher worked at Xerox Palo Alto Research Center and was Chief Technology Officer at Intelligent Markets, Inc. He has also served as the Chair of the John D. and Catherine T. MacArthur Foundation, an independent foundation that makes grants and impact investments to support non-profit organizations addressing global social challenges. Dr. Huttenlocher holds a Ph.D. in computer science and a Master of Science degree in Electrical Engineering, both from the Massachusetts Institute of Technology. Experience, Skills and Qualifications of Particular Relevance to Corning: Dr. Huttenlocher is a renowned computer science researcher and educator, inventor, innovator and entrepreneur with two dozen U.S. patents. He brings to the board extensive experience in technology innovation and commercialization, customer experience, software and the societal impact of artificial intelligence. In addition, his understanding of technical computing deepens our understanding of the cybersecurity landscape. | ||||||||||||||
| Top Skills Brought to Our Board | |||||||||||||||
| Public Company Board Experience | | Strategic Planning and Oversight |  | Cybersecurity and Information Security | ||||||||||
| Technology and Innovation | | Industry Experience | ||||||||||||
 | ||||||
Committees • • | • Executive | |||||
Current Public and • | ||||||
Public and Investment • | ||||||
| Experience | | Oversight | | ||
| ||||||
|
 | Kurt M. Landgraf Director Since 2007. Age Retired President, Washington College From July 2017 to July 2020, Mr. Landgraf was president of Washington College. He previously served as president and chief executive officer of Educational Testing Service (ETS), a private non-profit educational testing and measurement organization, from 2000 until his retirement in December 2013. Prior to that, he was executive vice president and chief operating officer of E.I. Du Pont de Nemours and Company (DuPont), where he Experience, Skills and Qualifications of Particular Relevance to Corning: Mr. Landgraf brings to the Board a wealth of executive management experience in public companies, non-profit entities, higher education, and government. As former chief executive officer of ETS and chief financial officer of DuPont, he brings broad financial expertise and operations skills and experience, as well as specialized knowledge of technology, transportation, education, finance, pharmaceuticals, health care, energy, materials, and mergers and acquisitions. | ||||||||||
| Top Skills Brought to Our Board | |||||||||||
| Public Company Board Experience | | Finance and M&A | | Risk Oversight | ||||||
| Accounting | | Corporate Governance and Ethics | | Compensation and Talent Management | ||||||
| Operations | | Strategic Planning and Oversight | | Industry Experience | ||||||
| CORNING 2024 PROXY STATEMENT | 45 |
Proposal 1 Election of Directors
 | ||||||||
Committees • •
| ||||||||
Current Public and • | ||||||||
Public and Investment • | ||||||||
| Experience | | | |||||
| | and Ethics | | |||||
| ||||||||
| | |||||||
Proposal 1 Election of Directors
 | Kevin J. Martin Director Since 2013. Age Vice President, US Public Policy, Meta Platforms, Inc. Mr. Martin is Vice President, US Public Policy at Meta Platforms, Inc. Prior to joining Meta, he was a partner and co-chair of the telecommunications practice at Squire Patton Boggs, an international law firm (2009 to 2015). From March 2005 to January 2009, he was chairman of the Federal Communications Commission (FCC). Mr. Martin has two Experience, Skills and Qualifications of Particular Relevance to Corning: With twenty-years of legal, telecommunications, technology, and policy experience, Mr. Martin brings exceptional experience to the Board as former chairman of the FCC. His extensive experience in regulation and government affairs, international relations, and the media, telecommunications and technology sectors provide a unique and important perspective on the global communications transformation in which Corning participates. | |||||||||||||
| ||||||||||||||
| ||||||||||||||
| ||||||||||||||
| Top Skills Brought to Our Board | ||||||||||||||
| Public Company Board | | Legal and Regulatory | | Strategic Planning and Oversight | |||||||||
| Technology and Innovation | | Industry Experience | |||||||||||
| 46 | CORNING |
Proposal 1 Election of Directors
  | Deborah D. Rieman Director Since 1999. Age Retired Executive Chairman, Metamarkets Group Dr. Rieman has more than Experience, Skills and Qualifications of Particular Relevance to Corning: Dr. Rieman brings to the Board significant expertise in information technology, innovation, and entrepreneurial | |||||||||||
Committees • Compensation (Chair) • Information Technology | ||||||||||||
Current Public and • None | ||||||||||||
Public and Investment Company Directorships Held During the Past 5 Years • None | ||||||||||||
| Top Skills Brought to Our Board | ||||||||||||
| Public Company Board Experience | | Risk Oversight | | Compensation and Talent Management | |||||||
| Strategic Planning and Oversight | | Cybersecurity and Information Security | | Technology and Innovation | |||||||
| Industry Experience | |||||||||||
| CORNING 2024 PROXY STATEMENT | 47 |
Proposal 1 Election of Directors
 | |||||||||
Committees • Compensation • | • Nominating and Corporate Governance (Chair) | ||||||||
Current Public and •None | |||||||||
Public and Investment • • NextEra Energy, Inc. • Ryder Systems Inc. | |||||||||
| Experience | | | ||||||
| and Oversight | | | ||||||
| |||||||||
Proposal 1 Election of Directors
Hansel E. Tookes II Director Since 2001. Age Retired Chairman and Chief Executive Officer, Raytheon Aircraft Company Mr. Tookes retired from Raytheon Company in December 2002. He joined Raytheon in 1999 and served as president of Raytheon International, chairman and chief executive officer of Raytheon Aircraft, and executive vice president of Raytheon Company. From 1980 to 1999, Mr. Tookes served United Technologies Corporation as president of Pratt and Whitney’s Large Military Engines Group and in a variety of other leadership positions. He is a former Lieutenant Commander and military pilot in the United States Navy, and Experience, Skills and Qualifications of Particular Relevance to Corning: Mr. Tookes has over 40 years of extensive experience in technology-driven business environments, operations, manufacturing, performance excellence, business development, and military and government contracting. He also brings his science and engineering education, military training, and strategic executive perspective to the Board. Mr. Tookes’ extensive industry and public company board experience supports his understanding of the corporate governance, executive compensation, and the ESG landscape, positioning him to effectively lead the Company’s Nominating and Corporate Governance Committee. | |||||||||||||||
Top Skills Brought to Our Board | |||||||||||||||
| Public Company Board Experience | | Risk Oversight | | Corporate Governance and Ethics | ||||||||||
| Legal and Regulatory | | Compensation and Talent Management | | Operations | ||||||||||
| Strategic Planning and Oversight | | Industry Experience | ||||||||||||
| 48 | CORNING 2024 PROXY STATEMENT |
Proposal 1 Election of Directors
Committees •
| |||||||||
Current Public and • | |||||||||
Public and Investment •
| |||||||||
| Experience | | | and Ethics | |||||
| | Talent Management | | ||||||
| and Oversight | | |||||||
Proposal 1 Election of Directors
 | Wendell P. Weeks Director Since 2000. Age Chairman and Chief Executive Officer, Corning Incorporated Mr. Weeks has served as the chief executive officer of Corning Incorporated since April 2005 and chairman of the board of directors since April 2007. He has held a variety of financial, commercial, business development, and general management positions across Corning’s businesses and technologies since he joined the company in 1983. Mr. Weeks currently Experience, Skills and Qualifications of Particular Relevance to Corning: Mr. Weeks’s leadership in many of Corning’s businesses, contributions to the development of numerous technologies, and experience over | ||||||||||||||
Top Skills Brought to Our Board | |||||||||||||||
| Public Company Board Experience | | Finance and M&A | | Risk Oversight | ||||||||||
| Accounting | | Industry Experience | | Compensation and Talent Management | ||||||||||
| Operations | | Strategic Planning and Oversight | | Technology and Innovation | ||||||||||
| CORNING 2024 PROXY STATEMENT | 49 |
Proposal 1 Election of Directors
 | ||||||||||
Committees • • Information Technology (Chair) | ||||||||||
Current Public and • | ||||||||||
Public and Investment • • Azenta, Inc. (formerly known as Brooks Automation, Inc.) | ||||||||||
| Experience | | | |||||||
| | | ||||||||
| | | ||||||||
| ||||||||||
Proposal 1 Election of Directors
 | Mark S. Wrighton Director Since 2009. Age
Dr. Wrighton has nearly 30 years of leadership experience overseeing large research universities. He currently serves Experience, Skills and Qualifications of Particular Relevance to Corning: Dr. Wrighton is a professor, chemist and research scientist with expertise in materials and research interests in the areas of transition metal catalysis, molecular electronics and photoprocesses at electrodes. He also has expertise in areas of direct relevance to Corning, including materials chemistry, photochemistry, surface chemistry and life sciences. Under Dr. Wrighton’s executive and fiscal leadership, Washington University in St. Louis grew significantly in academic stature, research enterprise, infrastructure, student quality, curriculum and international reputation. Dr. Wrighton brings to the Board his vast scientific knowledge and understanding of complex research and development issues. | |||||||||||||
| ||||||||||||||
| ||||||||||||||
| ||||||||||||||
| Top Skills Brought to Our Board | ||||||||||||||
| ||||||||||||||
| Public Company Board | | Finance and | | Risk Oversight | |||||||||
| Strategic Planning and Oversight | | Technology and Innovation | |||||||||||
| 50 | CORNING |


The Compensation and Talent Management Committee sets director compensation at levels that ensure our directors are paid appropriately for their time commitment and responsibilities relative to directors at companies of comparable size, industry and scope of operations. The Committee believes that providing a competitive compensation package is important because it enables Corning to attract and retain highly qualified directors who are critical to the Company’s long-term success. Our objective is to pay non-employee directors competitively compared to comparable companies and for a significant portion of director compensation to be stock-based.stock based. The Compensation and Talent Management Committee’s independent consultant, Frederic W. Cook & Co., Inc., conducts an annual review of the director compensation levels relative to external best practices as well as Corning’s compensation peer group and advises the Committee annually to ensure that compensation levels remain competitive.
The Company uses a combination of stock-based and cash compensation for its directors. Corning believes that a significant portion of director compensation should be linked to the Company’s performance over time. Therefore, a portion of the directors’ compensation is paid as an annual equity grant of restricted stock units (in 2022,2023, 60% of annual retainer), which are not settled in shares of common stock until retirement or resignation from the Board.
Directors may further defer receipt of theall or a portion of their cash compensation and may defer receipt of their annual equity retainer restricted stock units(in RSUs) by electing distribution in up to 10 annual instalments and also may defer all or a portion of their cash compensation.installments. Cash amounts deferred may be allocated to:to an account earning interest, compounded quarterly, at the rate equal to the prime rate of Citibank, N.A. at the end of each calendar quarter; a restricted stock unit account; or a combination of such accounts. In 2022,addition, in 2023 directors were given the opportunity to participate in the 2023 Cash for Equity Exchange Program, on the same basis as active employees, whereby they could exchange up to 40% of cash fees for the first half of 2023 in exchange for RSUs equal to 120% of the amount exchanged. All directors except for Mr. French (who joined the Board after the 2023 Cash for Equity Exchange Program election period concluded) participated in the 2023 Cash for Equity Exchange Program, and seven directors elected to defer some or alladditional portions of their cash compensation.compensation under the director deferral program. For more information on the 2023 Cash for Equity Exchange Program, see page 60.
As an employee of the Company, Mr. Weeks is not compensated separately for service on the Board or any of its Committees.committees.
20222023 Director Compensation
The following table outlines 20222023 director compensation.
| Annual Equity Grant | $ The grants are approved by the Board annually at its February meeting and directors joining after the February meeting receive a pro-rated grant for that year. | |||
| Annual Cash Retainer | $110,000. The retainer amount is approved by the Board annually at its February meeting and directors joining after the February meeting receive a pro-rated retainer for that year. | |||
| Lead Independent Director Additional Cash Compensation | $40,000 |
| CORNING 2024 PROXY STATEMENT | 51 |
Director Compensation
| Committee Chair Additional Cash Compensation | Audit Committee Chair: $25,000 Compensation and Talent Committee Chair: $20,000 Other Committee Chairs: $15,000 |
Director Compensation
| Committee Member Additional Cash Compensation | Audit Committee Members: $18,000 Compensation and Talent Committee Members: $15,000 Executive, Finance, Nominating and Corporate Governance, Information Technology, and Corporate Responsibility and Sustainability Committee Members: $10,000 |
In 2022,2023, the directors below performed the specified leadership roles:
| Name | Leadership Role | ||
| Mr. Clark | Lead Independent Director | ||
| Mr. Landgraf | Audit Committee Chair | ||
| Dr. Rieman | Compensation and Talent Management Committee Chair | ||
| Dr. Burns | Corporate Responsibility and Sustainability Committee Chair | ||
| Mr. Cummings | Finance Committee Chair | ||
| Mr. Tookes | Nominating and Corporate Governance Committee Chair | ||
| Dr. Wrighton | Information Technology Committee Chair |
Non-employee directors are reimbursed for expenses (including costs of travel, food, and lodging) incurred in attending Board, committee, and shareholder meetings. Directors are also reimbursed for reasonable expenses associated with participation in director education programs.
Directors’ Charitable Giving Programs
Although closed to directors joining the Board after October 5, 2016, Corning has a Directors’ Charitable Giving Program pursuant to which a director may direct the Company to make a charitable bequest to one or more qualified charitable organizations recommended by such director and approved by Corning in the amount of $1,000,000 (employee directors) or $1,250,000 (non-employee directors) following his or her death. This program is directly funded from general corporate assets. Because the charitable deductions accrue solely to Corning, the directors derive no direct financial benefit from the program, and we do not include these amounts in the directors’ compensation. Directors who had not yet achieved five years’ tenure as of October 5, 2016 were permitted to participate after five years of Board service. In 2022,2023, all directors except Messrs. Brun, Ferguson and FergusonFrench and Ms. Craig were eligible to participate in the program.
Directors are also eligible to participate in the Corning Incorporated Foundation Matching Gifts Program for eligible charitable organizations. This Program is available to all active Corning employees and directors. The maximumIn 2023, the matching gift amount available from the Foundation on behalf of each participant in the Program iswas $7,500 per calendar year.
Corning also pays premiums on our directors’ and officers’ liability insurance policies.
Changes to Director Compensation in 20232024
In February 2023,2024, the Board approved an increase to the non-employee directors’ annual equity grant from $205,000$215,000 to $215,000$225,000 as a competitive measure, as proposed by the Compensation and Talent Management Committee in consultation with the Committee’s independent consultant. This annual equity grant will be payable in restricted stock units, which will not be available for transfer or sale until six months after the date of a director’sunits.
In addition, beginning in 2024, Directors may elect to receive their equity retainer earlier than at retirement or resignation(as soon as 1 year from the Board.grant date), provided they make their election prior to the start of the calendar year in which the retainer is earned, and any such distribution would not result in the Director failing to meet the share ownership requirements described
on page 54.
| 52 | CORNING |
Director Compensation
20222023 DIRECTOR COMPENSATION TABLE
| Name | Fees Earned or Paid in Cash(1) ($) | Stock Awards(2) ($) | All Other Compensation(3) ($) | Total ($) | |||||||||
| Donald W. Blair | $138,000 | $205,024 | $7,500 | $350,524 | |||||||||
| Leslie A. Brun | 143,000 | 205,024 | 0 | 348,024 | |||||||||
| Stephanie A. Burns | 153,000 | 205,024 | 0 | 358,024 | |||||||||
| Richard T. Clark | 185,000 | 205,024 | 7,500 | 397,524 | |||||||||
| Pamela J. Craig | 138,000 | 205,024 | 5,000 | 348,024 | |||||||||
| Robert F. Cummings, Jr. | 155,000 | 205,024 | 0 | 360,024 | |||||||||
| Roger W. Ferguson, Jr. | 135,000 | 205,024 | 0 | 340,024 | |||||||||
| Deborah A. Henretta | 130,000 | 205,024 | 0 | 335,024 | |||||||||
| Daniel P. Huttenlocher | 130,000 | 205,024 | 0 | 335,024 | |||||||||
| Kurt M. Landgraf | 178,000 | 205,024 | 7,500 | 390,524 | |||||||||
| Kevin J. Martin | 130,000 | 205,024 | 7,500 | 342,524 | |||||||||
| Deborah D. Rieman | 155,000 | 205,024 | 0 | 360,024 | |||||||||
| Hansel E. Tookes II | 160,000 | 205,024 | 7,500 | 372,524 | |||||||||
| Mark S. Wrighton | 145,000 | 205,024 | 7,500 | 357,524 | |||||||||
| Name | Fees Earned or Paid in Cash(1) ($) | Stock Awards(2) ($) | All Other Compensation(3) ($) | Total ($) | ||
| Donald W. Blair | $138,000 | $220,542 | $7,500 | $366,042 | ||
| Leslie A. Brun | 143,000 | 220,742 | 0 | 363,742 | ||
| Stephanie A. Burns | 153,000 | 221,142 | 0 | 374,142 | ||
| Richard T. Clark | 185,000 | 222,422 | 0 | 407,422 | ||
| Pamela J. Craig | 138,000 | 218,472 | 0 | 356,472 | ||
| Robert F. Cummings, Jr. | 155,000 | 221,222 | 0 | 376,222 | ||
| Roger W. Ferguson, Jr. | 135,000 | 220,422 | 0 | 355,422 | ||
| Thomas D. French | 80,500 | 125,426 | 7,500 | 213,426 | ||
| Deborah A. Henretta | 130,000 | 220,222 | 0 | 350,222 | ||
| Daniel P. Huttenlocher | 130,000 | 220,222 | 0 | 350,222 | ||
| Kurt M. Landgraf | 178,000 | 219,422 | 7,500 | 404,922 | ||
| Kevin J. Martin | 130,000 | 220,222 | 0 | 350,222 | ||
| Deborah D. Rieman | 155,000 | 221,222 | 0 | 376,222 | ||
| Hansel E. Tookes II | 160,000 | 221,422 | 7,500 | 388,922 | ||
| Mark S. Wrighton | 145,000 | 220,822 | 7,500 | 373,322 |
| (1) | Includes all fees and retainers paid in cash or deferred pursuant to the Corning Incorporated Non-Employee Directors’ Deferred Compensation |
| (2) | The amounts in this column reflect the aggregate grant date fair value computed in accordance with FASB ASC Topic 718 of awards of restricted stock units granted pursuant to the 2019 Equity Plan for Non-Employee |
| (3) | The amounts in this column reflect charitable donation matches made by the Corning Foundation’s Matching Gifts Program. |
The following shows the total number of restricted stock awards, restricted stock unitsRSAs, RSUs and RSU deferrals each Director had outstanding at December 31, 2022.2023. No options were granted to any Director in 2022,2023, and as of December 31, 20222023 no Director had any outstanding options.
| Name | RSAs, RSUs and RSU Deferrals Outstanding at December 31, | ||
| Donald W. Blair | |||
| Leslie A. Brun | |||
| Stephanie A. Burns | |||
| Richard T. Clark | |||
| Pamela J. Craig | |||
| Robert F. Cummings, Jr. | |||
| Roger W. Ferguson, Jr. | |||
| Thomas D. French | 3,644 | ||
| Deborah A. Henretta | |||
| Daniel P. Huttenlocher | |||
| Kurt M. Landgraf | |||
| Kevin J. Martin | |||
| Deborah D. Rieman | |||
| Hansel E. Tookes II | |||
| Mark S. Wrighton |


Stock Ownership Guidelines
We believe in the importance of equity ownership by directors and executive management as a direct link to shareholders, and require all directors, named executive officers (NEOs), and non-NEO executive management to achieve the required levels of ownership under our stock ownership guidelines within five years of their election, appointment or designation. Restricted, direct and indirectly owned shares, and current and deferred restricted stock units, each count toward our stock ownership guidelines. An NEO who falls below the ownership requirement for any reason will have up to three years to return to the required minimum ownership level. All directors and NEOs who have been so for five years or more currently comply with the guidelines.
In December 2020, we increased the stock ownership guidelines applicable to non-NEO executive Senior Leadership Team members as a multiple of base salary from 1.5 to 3 in line with all NEOs other than the CEO whose multiple remains 6 times base salary. Newly-appointed Senior Leadership Team members have five years to comply with the new guidelines.
| DIRECTORS | CEO | OTHER NEOs and SENIOR LEADERSHIP TEAM MEMBERS | ||
| 5X Annual Cash Retainer | 6X Base Salary | 3X Base Salary |
Our directors and executive management are also subject to our anti-hedging and anti-pledging policies. For further information, see “Anti-Hedging Policy” and “Anti-Pledging Policy” both on page 76.74.
Delinquent Section 16(a) Reports
SEC rules require disclosure of those directors, officers, and beneficial owners of more than 10% of our common stock who fail to timely file reports required by Section 16(a) of the Securities Exchange Act of 1934 during the most recent fiscal year. Based on review of reports furnished to us and written representations that no other reports were required during the fiscal year ended December 31, 2022,2023, all Section 16(a) filing requirements were met with the exception of two Form 4s for Director Burns, covering the sale of 102 and 5 shares of common stock, respectively, that were not timely filed due to an administrative error at the reporting person’s financial advisor, who disposed of the shares held in a separately managed trust account unbeknownst to the reporting person.met.
| 54 | CORNING |
Stock Ownership Information
Beneficial Ownership Table
| As of December 31, 2022 | Shares Directly or Indirectly Owned(1)(2)(3) | Stock Options Exercisable Within 60 Days | Restricted Stock Units Vesting Within 60 Days | (A) Total Shares Beneficially Owned | Percent of Class | (B) RSUs and PSUs Not Vesting Within 60 Days(4) | Total of Columns (A) + (B) | |||||||||||||
| The Vanguard Group | — | — | — | 97,196,146 | (5) | 11.49 | % | — | — | |||||||||||
| Samsung Display Co., Ltd. | — | — | — | 80,000,000 | (6) | 9.5 | % | (7) | — | — | ||||||||||
| BlackRock, Inc. | — | — | — | 55,527,143 | (8) | 6.6 | % | — | — | |||||||||||
| Donald W. Blair | 17,243 | 17,243 | * | 78,451 | 95,694 | |||||||||||||||
| Leslie A. Brun | 0 | 0 | * | 26,359 | 26,359 | |||||||||||||||
| Stephanie A. Burns | 56,888 | 56,888 | * | 52,781 | 109,669 | |||||||||||||||
| Richard T. Clark | 41,962 | 41,962 | * | 35,433 | 77,395 | |||||||||||||||
| Pamela J. Craig | 0 | 0 | * | 7,181 | 7,181 | |||||||||||||||
| Robert F. Cummings, Jr. | 151,199 | 151,199 | * | 155,176 | 306,375 | |||||||||||||||
| Roger W. Ferguson, Jr. | 6,938 | 6,938 | * | 14,984 | 21,922 | |||||||||||||||
| Deborah A. Henretta | 25,965 | 25,965 | * | 69,411 | 95,376 | |||||||||||||||
| Daniel P. Huttenlocher | 13,910 | 13,910 | * | 34,875 | 48,785 | |||||||||||||||
| Kurt M. Landgraf | 62,957 | 62,957 | * | 118,093 | 181,050 | |||||||||||||||
| Kevin J. Martin | 31,506 | 31,506 | * | 46,045 | 77,551 | |||||||||||||||
| Deborah D. Rieman | 100,813 | 100,813 | * | 35,136 | 135,949 | |||||||||||||||
| Hansel E. Tookes II | 96,863 | 96,863 | * | 35,196 | 132,059 | |||||||||||||||
| Mark S. Wrighton | 66,088 | 66,088 | * | 35,053 | 101,141 | |||||||||||||||
| Wendell P. Weeks | 697,163 | (9) | 557,268 | 3,910 | 1,258,341 | * | 662,055 | 1,920,396 | ||||||||||||
| * | ||||||||||||||||||||
| Edward A. Schlesinger | 51,366 | 37,981 | 888 | 90,235 | * | 53,841 | 144,076 | |||||||||||||
| Lawrence D. McRae | 153,793 | 169,175 | 1,040 | 324,008 | * | 164,169 | 488,177 | |||||||||||||
| Eric S. Musser | 104,393 | 47,207 | 1,673 | 153,273 | * | 207,694 | 360,967 | |||||||||||||
| Lewis A. Steverson | 0 | 1,398 | 1,398 | * | 174,548 | 175,946 | ||||||||||||||
| All Directors and Executive Officers as a group (33 persons) | 2,042,127 | (10)(11) | 1,327,570 | 15,038 | (11) | 3,384,735 | * | 2,904,631 | 6,289,366 |
| As of December 31, 2023 | Shares Directly or Indirectly Owned(1)(2)(3) | Stock Options Exercisable Within 60 Days | Restricted Stock Units Vesting Within 60 Days | (A) Total Shares Beneficially Owned | Percent of Class | (B) RSUs and PSUs Not Vesting Within 60 Days(4) | Total of Columns (A) + (B) | |||||||||||||
| The Vanguard Group | — | — | — | 98,246,749 | (5) | 11.52 | % | — | — | |||||||||||
| Samsung Display Co., Ltd. | — | — | — | 80,000,000 | (6) | 9.4 | % | (7) | — | — | ||||||||||
| BlackRock, Inc. | — | — | — | 60,192,751 | (8) | 7.1 | % | — | — | |||||||||||
| Donald W. Blair | 17,243 | 17,243 | * | 88,956 | 106,199 | |||||||||||||||
| Leslie A. Brun | 0 | 0 | * | 33,455 | 33,455 | |||||||||||||||
| Stephanie A. Burns | 56,888 | 56,888 | * | 62,807 | 119,695 | |||||||||||||||
| Richard T. Clark | 41,962 | 41,962 | * | 42,816 | 84,778 | |||||||||||||||
| Pamela J. Craig | 0 | 0 | * | 13,890 | 13,890 | |||||||||||||||
| Robert F. Cummings, Jr. | 151,199 | 151,199 | * | 166,222 | 317,421 | |||||||||||||||
| Roger W. Ferguson, Jr. | 6,938 | 6,938 | * | 25,394 | 32,332 | |||||||||||||||
| Thomas D. French | 0 | 0 | 3,644 | 3,644 | ||||||||||||||||
| Deborah A. Henretta | 25,965 | 25,965 | * | 78,689 | 104,654 | |||||||||||||||
| Daniel P. Huttenlocher | 13,910 | 13,910 | * | 41,882 | 55,792 | |||||||||||||||
| Kurt M. Landgraf | 62,957 | 62,957 | * | 124,964 | 187,921 | |||||||||||||||
| Kevin J. Martin | 31,506 | 31,506 | * | 56,296 | 87,802 | |||||||||||||||
| Deborah D. Rieman | 100,813 | 100,813 | * | 42,314 | 143,127 | |||||||||||||||
| Hansel E. Tookes II | 96,863 | 96,863 | * | 42,408 | 139,271 | |||||||||||||||
| Mark S. Wrighton | 66,088 | 66,088 | * | 42,163 | 108,251 | |||||||||||||||
| Wendell P. Weeks | 862,041 | (9) | 474,609 | 11,304 | 1,347,954 | * | 491,378 | 1,839,332 | ||||||||||||
| * | ||||||||||||||||||||
| Edward A. Schlesinger | 66,081 | 39,717 | 2,934 | 108,732 | * | 67,981 | 176,713 | |||||||||||||
| Lawrence D. McRae | 213,063 | 115,052 | 1,554 | 329,669 | * | 98,099 | 427,768 | |||||||||||||
| Eric S. Musser | 180,159 | 53,490 | 6,021 | 239,670 | * | 184,240 | 423,910 | |||||||||||||
| Lewis A. Steverson | 29,378 | 0 | 3,448 | 32,826 | * | 146,959 | 179,785 | |||||||||||||
| All Directors and Executive Officers as a group (32 persons) | 2,579,274 | (10)(11) | 1,142,910 | 114,624 | 3,836,808 | * | 2,574,579 | 6,411,387 |
| * | Less than 0.50% |
| (1) | Includes shares of common stock subject to forfeiture and restrictions on transfer, granted under Corning’s Incentive Stock Plans. |
| (2) | Includes shares of common stock subject to forfeiture and restrictions on transfer, granted under Corning’s Restricted Stock Plans for non-employee directors. |
| (3) | Includes shares of common stock held by The Bank of New York Mellon Corporation as the trustee of Corning’s Investment Plans for the benefit of the members of the group, who may instruct the trustee as to the voting of such shares. If no instructions are received, the trustee votes the shares in the same proportion as it votes the shares for which instructions were received. The power to dispose of shares of common stock is also restricted by the provisions of the plans. The trustee holds for the benefit of Messrs. Weeks, Schlesinger, McRae, Musser and Steverson, and all executive officers as a group, the equivalent of |
| (4) | The Restricted Stock Units (RSUs) and Performance Share Units (PSUs) represented entitled the holder to receive the same number of unrestricted shares of common stock upon the lapse of restrictions, at which point shareholders will have sole investment and voting power. RSUs and PSUs that will not vest within 60 days of the date of this table are not considered beneficially owned for purposes of the table and therefore are not included in the Total Shares Beneficially Owned column because the holders are not entitled to voting rights or investment control until the restrictions lapse. However, ownership of these RSUs and PSUs further aligns our Directors and Executive Officers’ interests with those of our shareholders. |
| (5) | Reflects shares beneficially owned by The Vanguard Group (Vanguard), according to a Schedule 13G/A filed by Vanguard with the SEC on February |
| (6) | Reflects shares beneficially owned by Samsung Display Co., Ltd. (Samsung), according to a Schedule 13G/A filed by Samsung with the SEC on April 8, 2021, reflecting ownership of shares as of April 8, 2021. Samsung lists its address as 1, Samsung-ro, Giheung-gu, Yongin-si, Gyeonggi-Do, 17113, Republic of Korea. Samsung has sole voting power and/or sole dispositive power with respect to 80,000,000 shares and shared voting power and/or shared dispositive power with respect to 0. According to the Schedule 13G/A, Samsung beneficially owned 9.0% of our common stock as of April 8, 2021. |
| (7) | Samsung Display Co., Ltd.’s 80,000,000 shares of common stock were equal to |
| (8) | Reflects shares beneficially owned by BlackRock, Inc. (BlackRock), according to a Schedule 13G/A filed by BlackRock with the SEC on |
| (9) | Does not include |
| (10) | As of December 31, |


Our Board of Directors requests that shareholders approve the compensation of our Named Executive Officers (NEOs), pursuant to Section 14A of the Securities Exchange Act of 1934 (the “Exchange Act”), as disclosed in this proxy statement, which includes the Compensation Discussion and Analysis, the compensation tables and narrative disclosure on executive compensation.
While this vote is advisory and not binding on the Company, the Board of Directors values shareholder opinion and will consider the outcome of the vote in determining our executive compensation programs.
Say on Pay Proposal
Our Board maintains a “pay for performance” philosophy that forms the foundation for all Compensation and Talent Management Committee decisions regarding executive compensation. In addition, our compensation programs are designed to facilitate strong corporate governance, foster collaboration and support our short- and long-term corporate strategies.
The Compensation Discussion and Analysis portion of this proxy statement contains a detailed description of our executive compensation philosophy and programs, the compensation decisions the Compensation and Talent Management Committee has made under those programs and the factors considered in making those decisions. Our shareholders have affirmed their support of our executive pay programs in our outreach discussions and in their ongoing support of our Say on Pay proposals. We believe that we have created a compensation program deserving of shareholder support.
For these reasons, the Board of Directors recommends that shareholders vote in favor of the resolution:
RESOLVED, that the compensation paid to the Named Executive Officers disclosed in this proxy statement pursuant to the SEC’s executive compensation disclosure rules (which includes the Compensation Discussion & Analysis, the compensation tables and related narrative disclosure on executive compensation) is hereby APPROVED.
| FOR | Our Board unanimously recommends a vote FOR the approval of our executive compensation as disclosed in this proxy statement. |
| 56 | CORNING |
![]()

This Compensation Discussion & Analysis (CD&A) presents Corning’s executive compensation for 2022,2023, including the compensation for our Named Executive Officers (NEOs). It also describes how this compensation aligns with our pay-for-performance philosophy and recognizes the achievement of corporate goals.
OUR NEOsNEOS IN FISCAL YEAR 20222023 WERE:
| Named Executive Officer | Role | Years in Role | Years at Corning | ||
| Wendell P. Weeks | Chairman and Chief Executive Officer (CEO) | ||||
| Edward A. | Executive Vice President and Chief Financial Officer | (7 years as Corporate Controller) | |||
| Lawrence D. | Vice Chairman and Corporate Development Officer | 38 years | |||
| Eric S. Musser | President and Chief Operating Officer | ||||
| Lewis A. Steverson | Executive Vice President and Chief Legal and Administrative Officer |
*In a planned succession, Mr. Tripeny stepped downMcRae retired from the role of Chief Financial OfficerCompany as of February 18, 2022, in advance of his retirement. Mr. Schlesinger succeeded Mr. Tripeny as Chief Financial Officer on February 19, 2022.December 31, 2023.
CD&A Table of Contents
To assist you in finding important information, we call your attention to the following sections of the CD&A:
Compensation Discussion & Analysis
Executive Summary
Plan DesignPhilosophy and ComponentsApproach
Our compensation program is designed to attract and retain the most talented employees within our industry segments and to incentivize them to perform at the highest level while executing on our strategic priorities. In order to retain and motivate this caliber of talent, the Compensation and Talent Management Committee (the Committee) is committed to promoting a performance-based and team-based culture. Performance-based compensation is tied to financial metrics developed to incent management to deliver on our strategic priorities and our commitments to our shareholders. The majority of our executive compensation is directly aligned with our Company financial performance and the financial performance of our Market-Access Platforms (MAPs), or linked to the value of our common stock.
Our key compensation program principles are as follows:
| • | Pay for performance |
| • | Provide a competitive base salary |
| • | Apply a team-based management approach |
| • | Increase the proportion of performance-based incentive compensation for more senior positions |
| • | Align the interests of our executive group with shareholders |
Our Short-Term Incentives
Short-term incentives are designed to reward NEOs for Corning’s consolidated annual financial and operational performance supporting our strategic priorities and team-based management approach. Corning has two short-term incentive plans: the Performance Incentive Plan (PIP) and GoalSharing.
In 2021,As part of our 2023 Cash for Equity Exchange Program implemented to preserve corporate cash, 2023 cash PIP was exchanged in responseFebruary 2023 for Performance Stock Units (PSUs) vesting over 36 months. The PSU award is capped at 110% of the cash PIP target (versus the 200% cap that applies to a recommendation from the Committee, we adjustedcash PIP for our NEOs from 100%plan) and is based entirely on corporate financial performance metrics (as described in the chart below). See page 60 for more information about 2023 Cash for Equity Exchange Program.
GoalSharing Plans are local and business unit performance plans designed to 50% basedgive every employee the opportunity to be rewarded for achieving business objectives. Employee GoalSharing Plans are weighted 75% on local unit performance metrics (typically financial and/or continuous improvement objectives such as cost reduction, quality, or manufacturing performance) and 25% weighted on overall corporate financial performance and 50%performance. The NEO GoalSharing Plan is based on the average financial performancepayout of each of our MAPs, in order to put greater emphasis on the financial performance of the MAPs.all unit GoalSharing plans.
| Short-Term Incentives | |
Performance Incentive Plan (PIP)*
| NEO’s GoalSharing Plan
|
*Business Financial Performance is the average of the financial performance for the five MAPs
| 58 | CORNING |
Compensation Discussion & Analysis
Our Long-Term Incentives
We believe it is important that our long-term incentives drive the success of our strategic priorities and generate long-term value for our shareholders. We also believe it is important for a significant portion of LTI to be in the form of equity to align our executives’ financial interests with those of our shareholders.
Beginning in 2020 and in response to shareholder feedback, we realigned the form and payout method of the LTI plan by reducing the cash payout from 60% to 25% (paid in CPUs) and increasing the equity payout from 40% to 75% (paid in PSUs and RSUs). We also increased the overall weighting of corporate financial performance from 60% to 70%, with the addition of PSUs (and elimination of stock options). The LTI plan awards now include 45%are comprised of Performance Stock Units (PSUs) (45% of target), 25% Cash Performance Units (CPUs) (25% of target) and 30% Restricted Stock Units (RSUs) (30% of target).
2023 CPU and PSU payouts will be based 70% on Adjusted Free Cash Flow, and 30% on Core Net Sales with annual results being averaged over a three-year performance period (2023–2025). In addition to these corporate financial metrics, CPUs and PSUs are also subject to an ROIC modifier of up to +/- 10%, which acts as a multiplier, based on ROIC improvement over the three-year period against pre-established objectives.
Long-Term Incentives Paid in Cash (CPUs) and Equity (PSUs and RSUs) |
Long-Term Incentives
|
| CEO | ALL OTHER NEOs | ||
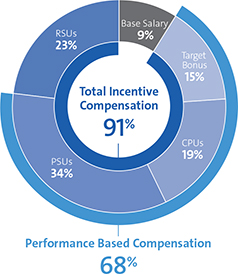  | |||
* The charts above reflects ordinary target compensation elements. In 2023 we utilized a Cash for Equity Exchange Program whereby each NEO voluntarily exchanged a portion of their cash salary for RSUs, and their 2023 cash PIP was automatically exchanged for PSUs (see page 60 for more details on the 2023 Cash for Equity Exchange Program).
Compensation Discussion & Analysis
20222023 Cash for Equity Exchange Program
Heading into 2023, we saw recession-level demand in virtually all of our MAPs and experienced significant inflationary cost pressures. To proactively conserve cash while we adapted to these business realities, we introduced the 2023 Cash for Equity Exchange Program. NEOs, along with other salaried employees, were offered the opportunity to exchange up to 40% of their base salary during the first six months of 2023 for RSUs equal to 120% of the salary amount exchanged, vesting over 18 months. Our external directors were also offered the opportunity to exchange up to 40% of their cash fees for the first six months of 2023 for RSUs equal to 120% of the fee amount exchanged.
Because the Cash For Equity base salary exchange was voluntary and employees would lose the opportunity for defined contribution plan and company matching contributions on those dollars exchanged, the Committee decided to provide 20% additional RSUs to incentivize employees to participate in the exchange. For example, in the US, an employee that contributes 6% of their salary to the Investment Plan receives a company matching contribution of 4%, for a total 10% defined contribution plan contribution. An employee that participated in the 2023 Cash for Equity Exchange and exchanged 6% of their salary for RSUs would have received a 20% special incentive of 1.2% in additional RSUs, for a total of 7.2% delivered in RSUs.
In addition, as part of the program, 2023 cash PIP was exchanged for PSUs, which vest over 36 months, are capped at 110% of the cash PIP target, and are based entirely on corporate financial performance metrics. The actual value earned by each NEO based on actual 2023 performance was only 51% of target. The difference between the number of PSUs awarded and the number of PSUs actually earned was forfeited.
2023 Performance Metrics
Our key compensation metrics focus and align leadership on the key drivers for creating long-term value for our shareholders. In 2022,2023, the Committee determined that our prior year key performance metrics – core net sales, profitability (as measured by Core EPS) and a cash flow measure (as measured by adjusted free cash flow) –were still the appropriate performance measures for 2022. In addition, in 2021 the Committee adjusted PIP for our NEOs from 100% weighted on corporate financial performance to 50% weighted on corporate financial performance and 50% weighted on the average financial performance of each of our MAPs to put greater emphasis on the financial performance in each of our five MAPs, and in 2022 a business core gross margin percentage goal was added to the goals for each of our MAPs to emphasize the importance of improving our core gross margin.2023.
20222023 Key Compensation Metrics
| Award | Type | Metrics Used | |||
| GoalSharing | Short-term/ Annual | 25% corporate financial performance 75% | |||
| PIP | Short-term/ |
•25% core net sales,
| |||
| CPUs/PSUs | Long-term/ three-year measurement period | Performance period metrics, average of three one-year performance periods: •30% core net sales, 70% adjusted free cash flow Long-term modifier: final result adjusted +/ |
| THREE-YEAR PAY-FOR-PERFORMANCE RESULTS | ||||
| 2022 | 2021 | 2020 | ||
| Short-Term Incentives: | ||||
| PIP (% of target) | 62.5% | 165% | 100% | |
| GoalSharing blended performance result (% of target) | 113% | 149% | 137% | |
| Long-Term Incentives: | ||||
| CPU and PSU performance result (% of target) | 49% | 175% | 181% | |
| Three-year RSU/CPU ROIC modifier (+/- up to 10%) | +10% | +3.0% | -10% | |
| Three-year performance results (average of three years’ performance X modifier) | 148.5% | 143% | 112% | |
*PIP is typically an annual bonus plan; however, the 2023 Cash for Equity Exchange PIP PSUs vest over three years.
| THREE-YEAR PAY-FOR-PERFORMANCE RESULTS | |||||
| (% of target) | 2023 | 2022 | 2021 | ||
| Short-Term Incentives (annual results): | |||||
| PIP | 51% | 62.5% | 165% | ||
| GoalSharing (% of base salary vs. 5% target) | 5.48% | 5.65% | 7.44% | ||
| Long-Term Incentives: | |||||
| CPUs and PSUs (annual result) | 56% | 49% | 175% | ||
| CPUs and PSUs (3-year average result) | 93% | 135% | 139% | ||
| x Three-year CPU/PSU ROIC modifier (up to +/- 10% multiplier) | +2.5% | +10% | +3.0% | ||
| CPU/PSU final result (3-year period ending) | 95.33% | 148.5% | 143% | ||
| The Committee made no discretionary adjustments to compensation results in 2023 (positive or negative). | |||||
| CORNING 2024 PROXY STATEMENT |
Compensation Discussion & Analysis
2023 Performance Overview: A Focus on Adaptation
and Operational Strength
In 2023, Corning delivered on its commitments, adapted to adverse global market dynamics and recession-level demand, and positioned ourselves to capture growth when consumer demand returns. Our 2023 results demonstrated continued progress in advancing our market leadership, strengthening our profitability, and improving our cash-flow generation even in the lower-demand environment we experienced in 2023. Core gross margin grew 330 basis points year-over-year and adjusted free cash flow necessary to fund operations and future investments finished the year at $880 million.
| Performance Results | ||||||
 |  |  |  | |||
| $13.6B | $1.70 | 330bps | $880M | |||
| In core net sales | In core EPS | Core gross margin improvement | In adjusted free cash flow | |||
Demand in most of our markets is temporarily depressed due to supply chain corrections and macroeconomic factors. Therefore, our sales are well below long-term trends even as we are outperforming on price and productivity plans. These market conditions create a unique opportunity for us to deliver another $3 billion-plus in annual sales, without incremental capital investment, in the medium-term as our markets normalize. As we capture that growth, we expect to deliver incremental profit and cash to our shareholders. We also remain confident that key industry growth drivers are intact: specifically, wireless, broadband, 5G, cloud computing, advanced artificial intelligence in Optical Communications, increased screen sizes in Display Technologies, tighter emission regulations that drive more and better filtration in Environmental Technologies and the need for increasingly advanced cover materials in Mobile Consumer Electronics. We have built a competitively-advantaged position for greater than 80% of our sales over the last few years—we are the technology leader, as well as the lowest cost producer in those markets. Additionally, we have opportunities to capitalize on growth in our markets by increasing our value capture with our More Corning content approach.
Leveraging Our Focused Portfolio of Compelling Long-Term Growth
Opportunities
Corning strives to be a catalyst for positive change and to help move the world forward. The company invents, makes and sells life-changing products based on a set of vital capabilities that are increasingly relevant to profound transformations that touch many facets of daily life.
Recent highlights include:
| • | Continuing to |
| • | Advancing optical innovations in broadband, 5G, cloud computing, and advanced AI. Corning’s fiber optics innovations and unique value proposition position the company to capitalize on opportunities in telecommunications, cloud computing, and advanced AI. |
| • | Advancing the driving experience by creating the next generation of automotive-interior displays. Corning technologies are playing a central role in enabling new flexible OLED vehicle cockpit displays that are sustainable, ready to integrate, and can dramatically enhance the driving experience for consumers, enabling individualized user experiences behind the wheel. |
| CORNING | 61 |
Compensation Discussion & Analysis
2022 Performance Overview: Optimism and Growth Despite an Uncertain and Challenging Environment
Despite an exceptionally challenging global business environment, including the continued rippling effects of COVID-19, global supply chain disruptions, higher inflation and more, Corning grew sales and advanced its strategic initiatives in 2022. Keeping our key objectives in mind, management and the Board focused on delivering value to our customers and stakeholders despite lower demand in markets constituting nearly half of Company sales.
| Performance Results | ||||||
 |  |  |  | |||
| $14.8B | $2.09 | 36% | $1.24B | |||
| In core net sales Up 5% YoY | In core EPS Up 1% YoY | Core gross margin | In adjusted free cash flow | |||
Beginning in 2020 with the onset of the pandemic, Corning defined two core priorities–ensuring the safety of our employees and workplaces and delivering for our customers. To ensure reliable customer product supply, we took measures to mitigate interruption of our raw material supplies. However, as a result of prioritizing our commitment to fulfill our customer needs in a higher inflation environment, our profitability and cash flow lagged our sales growth in 2022. The cost mitigation efforts and price increases we implemented across 2022, along with capacity and inventory adjustments made in the latter half of the year, were aimed at improving margins and having a positive impact on cash flow moving forward.
Leveraging Our Focused Portfolio of Compelling Long-Term Growth Opportunities
While the uncertain global macroeconomic environment continues to present challenges in our markets, we have a compelling set of long-term growth opportunities that we are capturing due to our focused and cohesive business portfolio—with more to come.
| • | |
| • | |
We continue to make progress on the leadership priorities we introduced in 2019 shortly before the pandemic. We set a goal to grow core net sales at a compound annual growth rate of 6 to 8 percent from 2019 through 2022. We exceeded that target and grew at greater than 8% CAGR, even in the face of the ongoing external challenges all companies confronted. We also have advanced significant strategic initiatives. We are delivering key fiber-to-the home and data
Compensation Discussion & Analysis
center solutions to meet surging demand, capitalizing on our gasoline particulate filter opportunities, and have introduced other new products that have driven strong performance despite depressed end-markets. We have also ramped our large scale display glass facilities to extend our leadership in the glass for large televisions, and made significant progress in our emerging innovations, such as automotive glass and pharmaceutical packaging. In summary, we have delivered multi-year sales growth in a challenging environment, extended our leadership positions across our markets, and paved the way for future growth.
Our Performance Metrics in Context
In 2023, we set our targets fairly flat year-over year, despite the macro-economic headwinds facing our businesses: • Core EPS: target set 0.5% above 2022 actual – 50% of target payout achieved • Core Net Sales: target set 0.6% above 2022 actual – 53% of target payout achieved • Adjusted Free Cash Flow: although targets are set independently each year, 2023 target was set $57M over 2022 actual – 58% of target payout achieved |
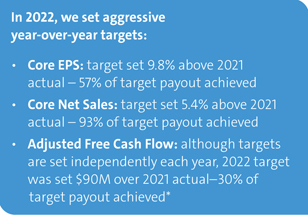
2022,2023, we again set rigorous targets across our key performance metrics. The metrics we use to measure our performance include Core Earnings Per Share, Core Net Sales, and Adjusted Free Cash Flow, with a 3-year ROIC modifier on our LTI (see below). These metrics and ROIC modifier were chosen because they are key drivers for creating long-term shareholder value and the financial indicators that best reflect the achievement of the strategic and operational objectives set out for our management team.
DespiteWe went into the COVID-19 pandemic, supply chain disruptions,year knowing that customer demand was declining. Our goals were to maintain flat revenues and anoffset inflationary economic environment, Corning has taken consistent actiontrends with cost reduction and improved business performance, so that we would be well positioned to capture growth when customer demand returned. Because of the increased uncertainty our performance curves were set with a “flat spot” designed to avoid a windfall payout should markets rebound quicker than anticipated. For example a $0.20 decline of EPS drops the payout to 80% but a $0.20 increase in the past three years to ensure the safetyEPS only reaches a payout of our employees and workplaces and to serve the needs of our customers. We remain focused on growth in110%. A similar “flat spot” principle was incorporated into all of our businesses and our approach resulted in total shareholder return that outperformed the S&P 500 in 2022. Corning’s cohesive and focused portfolio continues to provide strategic resilience in the current environment, and Corning remains well positioned to deliver long-term growth for our shareholders.2023 targets.
While share price performance is extremely important and considered by the Committee, our executive compensation program, particularly for our CEO, is heavily based on our performance against underlying metrics that support long-term shareholder value creation, including the financial and operational metrics identified by our shareholders as meaningful for our business. We believe Corning remains in an excellenta strong position to execute on our leadership priorities and deliver sustainable shareholder value.
| Our Performance Against Our Corporate Metrics | ||||||||||||||
Core EPS: Measure of Corporate Profitability | Core Net Sales: Indicator of Short- and Long-term Success | Adjusted Free Cash Flow: Indicator of the Ability to Invest in Growth and Return Value to Shareholders | ||||||||||||
$ 2022 | $2.10 2023 | $1.70
| $ 2022 | $ 2023 | $13.58 B 2023 | $1.24 B 2022 | $
|
|
|
| $ |
| ||
|
of |
|
of |
|
of | |||||||||
ROIC Modifier: Target: Result: ROIC |
| |||||||||||||
| 62 | CORNING |
Compensation Discussion & Analysis
| Our Metrics and Why We Use Them | ||
Core Earnings per Share (Core EPS): Core EPS is our key measure of profitability. (Note: Corning budgets for share repurchases when establishing annual financial Core Net Sales: Growing core net sales — both organically through innovation and through acquisitions — remains critical to our short- and long-term success. | Adjusted Free Cash Flow: Strong cash generation enables us to invest in future growth, sustain leadership in our markets and provide returns to shareholders, and financially strong during periods of uncertainty. It also requires us to carefully manage our capital investments. | |
| Return on Invested Capital (ROIC): We focus on ROIC because it reflects our ability to generate returns from the capital we have deployed in our operations. Earned CPUs and PSUs will be increased or decreased up to 10% as a multiplier based on Corning’s ROIC improvement over the three-year performance period. |
Shareholder Returns
Corning prioritizes delivering returns to our shareholders. In February 2023 we announced a 3.7% increase in ourFor information about Corning’s 5-year common dividend per common share, representing the 12th consecutive annual increase and a 180% cumulative increase over the past 10 years. The second chart below shows Corning’s Total Shareholder Return (TSR) for one-, three- and five-year periods, consisting of stock price appreciation and reinvestment of common dividends, as compared with the TSR of the S&P 500 over the same periods.
| ||
 |  | |
Despite the COVID-19 pandemic, supply chain disruptions, and an inflationary economic environment, Corning has taken consistent action across the past three years to protect our employees and to serve our customers and communities. We remain focused on growth, in all of our businesses and our approach resulted in total shareholder return that outperformed the S&P 500 in 2022. Corning’s cohesive and focused portfolio continues to provide strategic resilience in the current environment, and Corning remains well positioned to deliver long-term growth for our shareholders.
see page 9. The Company’s TSR performance is important for management and the Board. However, since ourBoard; however, the Compensation Committee has chosen to focus on performance metrics that are used to incent employee behavior,also drivers for creating long-term shareholder and that our planemployees can actively impact via their performance metrics (i.e., core net sales, core EPS, adjusted free cash flow and ROIC) reflect drivers for creating long-term shareholder value that our employees can actively impact via their performance.ROIC improvement.)
ANNUALIZED TOTAL SHAREHOLDER RETURN As of December 31, 2023 |
|
Compensation Discussion & Analysis
Shareholder Engagement

20222023 Annual Meeting of shareholders, our Say on Pay proposal received support from 90%91% of votes cast. We have received an average of 91% support for our Say on Pay proposal over of the past three years.We view this level of shareholder support as an affirmation of our current pay practices and pay for performance philosophy.
Shareholder Outreach. During the 2022-2023 proxy2023-2024 outreach season, we contacted shareholders representing 58%52% of our outstanding shares to encourage engagement, and met with shareholders representing approximately 43%27% of our outstanding shares, including eightfive out of our ten largest shareholders.At these annual meetings, executive management, Board members, Investor Relations and the Corporate Secretary engage with our largest investors to understand their perspectives on a variety of matters, including executive compensation, risk oversight, board composition and leadership structure, corporate governance policies and corporate sustainability practices.
 Investors were complimentary of our GHG reduction goals, gender pay equity success, and board diversity, and continue to be pleased with our strategic priorities and business results.
Corporate Governance
|
Sustainability
|
People
| ||||
| An integrated outreach team | Engagement Process |
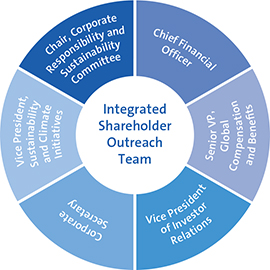 | During our off-season engagement calls, executive management, Board members, Investor Relations and the Corporate Secretary engage with our largest investors to understand their perspectives on a variety of matters, including executive compensation, risk oversight, board composition and leadership structure, corporate governance practices and sustainability practices. Investors were complimentary of our GHG reduction goals, gender pay equity success, and board diversity, and continue to be pleased with our strategic priorities. Corning’s efforts to promote a diverse and equitable workforce were widely viewed as a differentiating element of the Company with positive actions toward diversity at both the board and Company level. We received positive feedback and heard general support of our executive compensation program and design changes made in recent years. Shareholders were pleased with the use of our strategic metrics to align executive incentives with long-term value creation. We look forward to continuing these engagements and incorporating shareholder feedback into our compensation program design. |
| 64 | CORNING 2024 PROXY STATEMENT |
Compensation Discussion & Analysis
Shareholder feedback is regularly shared with the use of our strategic metrics to align executive incentives with long-term value creation. We look forward to continuing these engagementsfull Board and incorporating shareholder feedbackincorporated as appropriate into our compensation program design.
decision-making. We have taken into accountconsidered the views of our shareholders when making many of our governance and disclosure decisions in recent years, including:
| • | Enhancing disclosure about board refreshment and board diversity |
| • | Enhancing our directors’ skills matrix, and highlighting those skills considered most important to Corning |
| • | Expanding disclosure regarding our supply chain sustainability practices and resiliency, as well as supplier practices and compliance with our supplier code of conduct |
| • | Expanding disclosure about the board’s role in strategic planning and risk oversight |
| • | Enhancing disclosure and governance regarding political contributions |
| • | Publishing a Sustainability Report, |
| • | Disclosing our annual EEO-1 Report concurrently with our Sustainability Report |
| • | Enhancing disclosure about human capital management and the efforts of our Office of Racial Equity and Social Unity |
| • | Adjusting our executive LTI program design |
| • | Adopting proxy access |
We also communicate with shareholders through a number of routinemultiple forums, including quarterly earnings presentations, SEC filings, Proxy Statements, our online annual communications, our Sustainability Report, our Diversity and Inclusion Report, the Annual Meeting of shareholders, investor meetings and conferences and web communications. We relay shareholder feedback and trends on corporate governance and sustainability developments to our Board and its Committees and work with them to both enhance our practices and improve our disclosures.
In addition to our annual shareholder outreach, throughout the year we engage with a wide range of constituents including other institutional shareholders, retail shareholders, proxy advisory firms, and ESG rating firms, among others, in order to address questions or concerns, provide prospective on Company policies and practices, and to incorporate feedback as appropriate.
Compensation Discussion & Analysis
Responding to Shareholder Feedback in Concrete Ways
Corning takes our shareholders’ feedback seriously. The chart below shows adjustments we have made to our executive compensation program in response to feedback received during our shareholder engagement in recent years.
|
20222023 Executive Compensation Program Details for NEOs
Base Salary
Base salaries provide a form of fixed compensation and are reviewed annually by the Committee, which considers internal equity and individual performance, as well as competitive positioning, as discussed in the “Compensation Peer Group” section starting on page 74.72. In 2022, Messrs. Weeks’, Musser’s, McRae’s and Steverson’s2023, our NEOs did not receive any increase in base salaries were increased by 3.25%salary, in line with increases of U.S.all salaried employees. Mr. Schlesinger received a base salary increase of 55.4% as part of his promotion to Executive Vice President and Chief Financial Officer.
Short-Term Incentives
Short-term incentives are designed to reward NEOs for Corning’s consolidated annual financial and operational performance supporting our strategic priorities and team-based management approach. Corning has two short-term incentive plans: the Performance Incentive Plan (PIP) and GoalSharing.
Compensation Discussion & Analysis
PIP targets are established by the Committee each February as a percentage of the NEO’s salary depending on the competitive marketplace and his or her level of experience.
In 2022,2023, PIP targets (as a percentage of base salary) for our NEOs were as follows:
| 2023 PIP Target (% of base salary) |
| Wendell P. | 150%
|
| Edward | 90% (Increased from 80% to better align with external market benchmarks)
|
| 85%
|
| Eric S. | 140% (increased from 120% to better align with external market benchmarks)
|
| Lewis A. | 95% (unchanged from prior year’s target) |
| CORNING 2024 PROXY STATEMENT | 65 |
Compensation Discussion & Analysis
As discussed on page 60, cash PIP in 2023 was based 50% onexchanged for PSUs for NEOs, capped at 110% of target. PSU performance measures were 100% corporate financial performance (75% of which was based on core EPS and 25% on core net sales). 2023 core EPS performance was 50% of target, and 50% on the average financial performance of the five MAPs (25% of which was based on core net sales 25% on adjusted free cash flow and 30% on core NPATwas 53% of each MAP and 20% on core gross margin percent, respectively.). 2022 corporate performance was 66% weighted at 50% and the average financial performance of Corning’s five MAPs was 59% weighted at 50%,target, resulting in a final PIP result of 62.5%PSUs earned at 51% of target.
GoalSharing is designed to motivate employees to work together to achieve the most critical goals in each business unit. All Corning employees are eligible for GoalSharing with a target opportunity generally equal to 5% of base salary. GoalSharing awards may be 0% to 10% of base salary and the award is weighted 25% on corporate financial performance (using the same metrics as under theused for PIP) and 75% on the applicable business unit performance.
NEOs’ GoalSharing is based 25% on corporate financial performance and 75% on the average of the results of all business unit plans. In 20222023 the NEO’s GoalSharing was earnedpaid out at 5.65%5.48% of base salary.
PIP and GoalSharing payouts are each capped at 200%.
See page 6960 for details on the 20222023 PIP and GoalSharing metrics and actual results for the year.
Long-Term Incentives
Beginning in 2020, the Long-Term Incentive (LTI) Plan components were realigned. The percentage of LTI provided in cash (CPUs) was reduced from 60% to 25% and the percentage of LTI delivered in equity was increased from 40% to 75%. Stock options were eliminated. PSUs were added with PSUs comprising 45% of the LTI target and RSUs comprising 30% of the target. The total percentage of LTI tied to corporate financial performance increased from 60% to 70%, with the other 30% tied to the value of our common stock.
We believe it is important to link LTI metrics to financial measures that will drive the success of our strategic priorities and generate long-term value for our shareholders. We also believe it is important for a significant percentage of LTI to be in the form of equity to align our executives’ financial interests with those of our shareholders.
Our LTI construct for 2023 is as follows:
| Vehicle | |||||||||||||
| % of LTI Target | Cash | Equity | Performance-Based | Time-Based | |||||||||
| Cash Performance Units (CPUs) | 25% | ✓ | ✓ | ||||||||||
| Performance Share Units (PSUs) | 45% | ✓ | ✓ | ||||||||||
| Restricted Stock Units (RSUs) | 30% | ✓ | ✓ | ||||||||||
LTI targets are established by the Committee for each NEO annually in February. Mr. Weeks’ 2022
In 2023, LTI target was $12.65 million. Other NEOs’ targets may be found in footnote 2 to the Summary Compensation Table on pages 77–78 and range from $2 million to $4.75 million.for our NEOs were mostly unchanged as follows:
| Wendell P. Weeks | $12,650,000 (unchanged from prior year’s target) |
| Edward A Schlesinger | $2,350,000 (increased by $350,000 to better align to external market benchmarks) |
| Lawrence D. McRae | $2,600,000 (unchanged from prior year’s target) |
| Eric S. Musser | $4,750,000 (unchanged from prior year’s target) |
| Lewis A. Steverson | $3,800,000 (unchanged from prior year’s target) |
Compensation Discussion & Analysis
20222023 Key Compensation Metrics
| Award | Type | Metrics Used | |||
GoalSharing (Cash) | Short-term/ Annual | 25% corporate financial performance 75% | |||
| PIP | Short-term/ Annual* |
•25% core net sales •75% core EPS
| |||
| CPUs/PSUs | Long-term/ | Performance period metrics, average of three one-year performance periods: •30% core net sales •70% adjusted free cash flow Long-term modifier: |
*PIP is typically an annual bonus plan; however, the 2023 Cash for Equity Exchange PIP PSUs vest over three years.
| 66 | CORNING 2024 PROXY STATEMENT |
Compensation Discussion & Analysis
Additional Context for Core Net Sales Metric
Core net sales,, which is a metric used in both our STI (PIP) and LTI plans, is a primary indicator of Corning’sCorning’s long- and short-term success. Evaluating performance against predetermined net sales targets provides insight into how well the Company has both retained and grown sales, accounting for both organic growth efforts and the impact of acquisitions.
We use core net sales as a performance measure in our annual GoalSharing and PIP plans because those GoalSharing impacts every employee and PIP impacts over 8,000 employees. In this way, every employee has goal alignment with Corning’s growth goals. Core net sales is also included as a performance measure in the LTI plan, impacting approximately 350 senior executives and key employees, because those employees are responsible for driving the long-term financial growth of the Company.
Incorporating core net sales performance into both STI and LTI plans allows for a comprehensive evaluation of Corning’s ability to establish sustainable sales growth while also addressing near-term market fluctuations, which drives both short- andshort-and long-term value.Core net sales is a “duplicate goal” for only about 350 ourout of approximately 57,00049,800 employees, and the Committee believes the increased focus on core net sales growth is appropriate for that smaller group of executives given the importance of sales growth for Corning over time.
How Corning Uses Other Metrics
In addition to corporate financial measures, each year the Company establishes key operational objectives, typically linked to key business, technology, financial, supply chain and human capital goals. These operational objectives are, in turn, cascaded into division and operational unit annual objectives. Unit GoalSharing plans contain goals linked to those unit objectives, creating alignment with the key Company operational objectives.
Other important initiatives such as sustainability, diversity, and safety that the Company continuously monitors are factored into short-term incentives for employees directly responsible for such efforts. Acknowledging that specific operational objectives and other special initiatives are reflected in operational unit annual objectives and other focused short-term incentives, the Committee has elected to focus on key financial metrics in the design of executive compensation, as described in this CD&A.
2023 |
Compensation Discussion & Analysis
2022 Performance and Compensation Alignment
In 2022, we set challenging goals across our portfolio through our “More Corning” strategy,2023, as customer demand declined to recessionary levels in which we sell more Corning content into the products consumers already buy through eachmany of our Market-Access Platforms. Formarkets, our goals were to maintain sales, improve business performance and offset the three-yearimpacts of higher inflation. Although we were able to partially achieve our goals, we could not completely offset the impact of reduced customer demand and higher inflation; as a result, our performance period ending in 2022, 2020 CPUs and PSUs earned 148.5% of target, reflecting three-year core net sales growth CAGR of more than 8%, cumulative three-year adjusted free cash flow of over $3.7B and a 250 basis point improvement in ROIC. While we are pleased to have delivered near-target core net sales growth in such a challenging year, our profitability and cash flow results were wellsignificantly below target. Our blended PIP resultWe froze base salaries, enabled a voluntary exchange of 62.5%a portion of salary for RSUs vesting over 18 months, kept short- and long-term incentive targets flat for most NEOs and exchanged cash PIP for PSUs (which will payout at 51% of target over the 36 month vesting period). Pay for our NEOs year-over-year is down (and realized pay down even more) aligning to our below-target results. Nonetheless, we did realign and improve our operational performance result of 49% (which impacts the 2022 performance component of the three open three-year cycles of CPUs and PSUs) demonstrate thatare well positioned for growth as our short- and long-term payouts are aligned with our performance in the areas most important to the Company — sales growth, cash generation and profitability.markets rebound.
See page 6261 for more performance highlights.
Details of our financial targets for 20222023 compared to 20212022 actual results are shown on the chart on page 6362 and demonstrate the rigor we apply to setting targets for compensation purposes.
| CORNING 2024 PROXY STATEMENT | 67 |
Compensation Discussion & Analysis
Details of 20222023 Performance Targets and Results
STI 2022:2023 PIP PSUs & GoalSharing Corporate Performance Measures
(50%100% of PIP and 25% of GoalSharing)
![]()
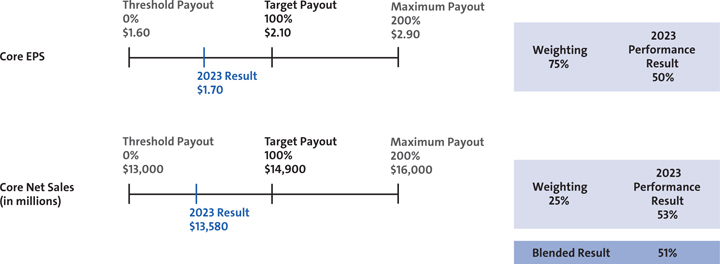
from 2021 Actual | ||||||||||||
(50% of PIP) average of 5 MAPs | ||||||||||||
PIP: The final PIP PSU payout for NEOs was 62.5%is 51% of target, based onwith units vesting over 3 years from the averagegrant date of 1) the corporate financial performance shown in the chart above (66%, weighted at 50%)February 8, 2023. Unearned units are forfeited and 2) the average of the financial performance for the five MAPs (59%, weighted at 50%). We do not disclose the targets or actual results individually for our five MAPs because we believe doing so would cause competitive harm. We have disclosed above how the aggregate average MAP targets compared to prior year and the blended result performance of the 5 MAPs above to demonstrate that our targets are rigorous.canceled.
GoalSharing: The final GoalSharing payout for NEOs was 113% of target (or 5.65%is 5.48% of their base salaries).salaries. GoalSharing is based on the blended result of 1) the corporate financial performance shown in the chart above (66%(51%, weighted at 25%) and 2) the average performance of over 100 unit plans (128%(129%, weighted at 75%).
Compensation Discussion & Analysis
LTI: 20222023 CPU and PSU Performance Measures
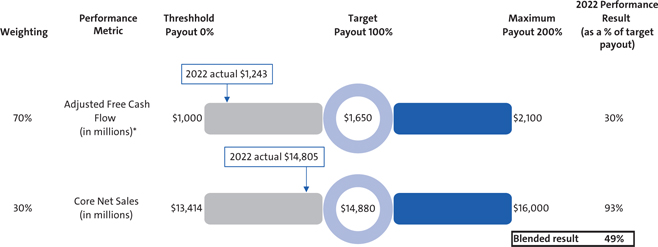
*Adjusted free cash flow goals are not set with reference to the prior year’s goal or resultsPSUs and are set independently each year. Refer to Appendix A for additional information on Adjusted Free Cash Flow for compensation purposes.
Please see page 6 for more information about our Core Performance MeasuresCPUs represent 45% and Appendix A for a reconciliation25% of the non-GAAP annual target LTI value, respectively. Payout is based on cash generation and sales growth—measures to the most directly comparable GAAPthat support our long-term financial measures.
LTI: CPUhealth and PSU ROIC Modifiersuccess. The 2023 performance measures for the 3-Year LTI Plan Ending December 31, 2022 3-year ROIC improvement
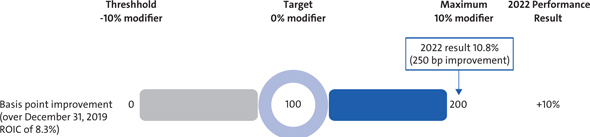
We define ROIC as core net income before interest, divided by invested capital. Core net income before interest is calculated using constant exchange rates for Japanese yen, South Korean won, Chinese yuan, new Taiwan dollar,PSUs and the euro against the U.S. dollar, and a constant tax rate of 21%. Invested capital is the sum of total assets less total liabilities and debt.CPUs are:
| Adjusted free cash flow (70%) which focuses on generating cash to ensure the Company’s financial stability and to allow for investment in innovation and future growth, and |
| 2) | Core net sales (30%) which focuses on growth. |
Actual CPUs and PSUs earned are based on the average of the actual performance for each year in the three-year period and are subject to an ROIC modifier of up to ±10% (for the years 2022, 2023, 2024 and 2024)2025). CPUs and PSUs granted in 20222023 will be vested and released (in the case of PSUs) and paid out (in the case of CPUs) in 20252026 based on pre-established performance goals, which are set at the start of each respective year, and the three-year ROIC modifier which is established at the beginning of the three-year performance period.period, and acts as a multiplier of -10% to +10% to the three-year average at the end of the performance period (depending on ROIC improvement over the period).
See page 6169 for details on the 20222023 PSU and CPU metrics and actual results for the year as well as the results for the 3-year plan ending in 2022,2023, covering the performance period from 2020-2022.2021-2023.
RSUs represent 30% of the annual target LTI value. The number of RSUs granted is determined based on the closing stock price on the grant date (the first business day in April), and awards cliff vest approximately three years from the grant date.
| CORNING |
Compensation Discussion & Analysis
2023 CPU & PSU Performance Measures
![]()
*Adjusted free cash flow goals are not set with reference to the prior years’ goal or results and are set independently each year.
Please see page 7 for more information about our Core Performance Measures and Appendix A for a reconciliation of the non-GAAP measures to the most directly comparable GAAP financial measures.
2021-2023 CPU and PSU ROIC Modifier (Multiplier)
3-year ROIC Improvement
Starting Point - December 31, 2020 - ROIC: 6.8%
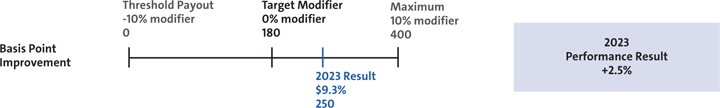
We define ROIC as core net income before interest, divided by invested capital. Core net income before interest is calculated using constant exchange rates for Japanese yen, South Korean won, Chinese yuan, New Taiwan dollar, and the euro against the U.S. dollar, and a constant tax rate of 21%. Invested capital is the sum of total assets less total liabilities and debt.
| CORNING 2024 PROXY STATEMENT | 69 |
Compensation Discussion & Analysis
CPUs and PSUs — Our Three-Year Performance Period Measurements— How It Works

TableThe following illustration shows how earned CPUs and PSUs are calculated at the end of Contentsthe three-year performance period. The 2023 performance result is the third performance year of the three-years ending in 2023 (2021, 2022 and 2023), which is averaged and then subject to the ROIC modifier, which is a multiplier (of up to +/- 10%) on the average result.
Compensation Discussion & Analysis
*Performance targets are generally established in February each year for the calendar year. See page 68 for performance measures and results for the applicable year.
**3-year ROIC improvement target is established at the beginning of each three-year performance period. See page 69 for the 2021-2023 performance measures and results.
CEO Compensation
Over the past eighteennineteen years, under the leadership of Mr. Weeks, Corning has grown significantly, achieved the lowest cost position and market leadership in key businesses, and created new-to-the-world product categories, such as Corning® Gorilla®Corning® Gorilla® Glass, heavy-duty diesel substrates and filters, customized fiber-to-the-home solutions and Corning Valor®Valor® Glass. During his tenure, Corning’s workforce has also increased by approximately 36,000 employees, or 70%.
Mr. Weeks’ significant experience and tenure as a CEO has been of particular value to the Company and its Directors as we navigated the pandemic, supply chain disruptions, and the current inflationary economic environment, having successfully steered the Company through other periods of significant uncertainty. However, due to the macro-economic challenges impacting the Company, the Committee left Mr. Weeks’ target compensation flat in 2023.
| • | Base salary – Mr. |
| • | Short-Term Incentives – |
| • | Long-Term Incentives – target |
Ninety-one percent of Mr. Weeks’ target pay is directly tied to Corning’s business, operating and financial performance andor stock price.price (via equity).
| 70 | CORNING 2024 PROXY STATEMENT |
Compensation Discussion & Analysis
Robust Compensation Program Governance
Corning has rigorous and robust governance with respect to its executive compensation plan:
| What We Do |   | What We Don’t Do | ||
| x No tax gross-ups or tax assistance on perquisites x No repricing or cash buyout of underwater stock options without shareholder approval x No excise tax gross-ups for officer agreements | |||
Compensation Discussion & Analysis
Employee Benefits and Perquisites
Employee Benefits: Our NEOs are eligible to participate in the same employee benefits plans as all other eligible U.S. salaried employees. These plans include medical, dental, life insurance, disability, matching gifts, qualified defined benefit and defined contribution plans. We also maintain non-qualified defined benefit and defined contribution retirement and long-term disability plans with the same general features and benefits as our qualified plans for all U.S. salaried employees affected by tax law compensation, contribution or deduction limits.
In addition to the standard benefits available to all eligible U.S. salaried employees, the NEOs are eligible for the benefits and perquisites described in this section.
Executive Supplemental Pension Plan (ESPP):We maintain an ESPP to reward and retain long-serving individuals who are critical to executing Corning’s innovation strategy. Our non-qualified ESPP covers approximately 23about 20 active participants, including all of the NEOs. In 2006, we capped theThe percentage of cash compensation earned as a retirement benefit under the ESPP atis a maximum of 50% of final average pay for 25 or more years of service, a change that applies to all the NEOs.service. The definition of pay used to determine benefits includes base salary and annual cash bonuses. Long-term cash or equity incentives are not included and do not affect retirement benefits. Executives must have at least ten years of service to be vested under this plan. As of December 31, 2022,2023, all NEOs except Mr. Steverson meet the ten-year vesting requirement.
While we seek to maintain well-funded qualified retirement plans, we do not fund our non-qualified retirement plans.
For additional details of the ESPP benefits and plan features, please refer to the section entitled “Retirement Plans” on page 85.83.
| CORNING 2024 PROXY STATEMENT | 71 |
Compensation Discussion & Analysis
Executive Physical and Wellness:All executives are eligible for an annual physical exam in addition to wellness programs sponsored by Corning for all employees. The cost of the physical is reported under perquisites in the Summary Compensation Tables.
Other Executive Perquisites:We provide the NEOs with an allowance that can be used for home security, modest personal aircraft usage, and limited financial counsellingcounseling services. Each NEO is responsible for all taxes on the imputed income resulting from these perquisites.
Given the limited commercial flight options available in the Corning, New York area, the Committee believes that a well-managed program of limited personal aircraft use provides an extremely important benefit at a reasonable cost to the Company. We closely monitor business and personal usage of our planes and limit personal usage to keep it at a low percentage of total usage. The Committee establishes annual personal aircraft usage caps under this program (both hours and absolute dollar value) for each NEO. The established cap for the CEO was 100 hours and $170,000; the cap for Mr. Musser was 90 hours and $147,500; the cap for the other NEOs was approximately half this leveltwo-thirds of the CEO cap or lower. Actual utilization in 20222023 fell well below these caps. For additional details, refer to footnotes relating to “All Other Compensation” included with the Summary Compensation Table starting on page 77.76.
Executive Severance:We have entered into severance agreements with each NEO. The severance agreements provide clarity for both Corning and the executive if the executive’s employment terminates. By having an agreement in place, we avoid the uncertainty, negotiations and potential litigation that may otherwise occur in the event of termination. The agreements are competitive with market practices at many other large companies and are helpful in retaining senior executives. Additional details can be found under “Arrangements with Named Executive Officers” on page 88.
Compensation Discussion & Analysis86.
Executive Change-in-Control Agreements: The Committee believes that it is in the best interests of shareholders, employees and the communities in which Corning operates to ensure an orderly process if a change in control were to occur. The Committee also believes it is important to prevent the loss of key management personnel (who would be difficult to replace) that may occur in connection with a potential or actual change in control. Therefore, we have provided each NEO with a change-in-control agreement (separate from the severance agreements described above). The change-in-control agreements provide that an executive’s employment must be terminated or effectively terminated in connection with a change in control in order to receive severance benefits. Additional details about the specific agreements can be found under “Arrangements with Named Executive Officers – Change-in-Control Agreements” on page 90.88.
| In 2012, the Committee approved updated forms of agreements for all corporate officers entering into severance and change-in-control agreements after July 2004. These agreements contain no provision for |
Compensation Peer Group
Corning is a diversified technology company with five reportable business segments. The majorityMost of our businesses do not have U.S. public company peers. Most of our businesses compete with non-U.S. companies in Asia and Europe, or privately-heldprivately held companies that do not provide comparable executive compensation disclosure and, while such businesses may be a competitor to one of our businesses, isare not a peerappropriate peers to our Company as a whole. In attempting to identify peer companies for compensation purposes, Corning must look to globally diversified companies or innovation companies in other industries to find organizations of similar size and complexity (when viewed in terms of revenues, net income, market capitalization, assets and number of employees). These companies, and not competitors to our individual businesses, are those included in our Compensation Peer Group.
•Our largest competitors and most relevant financial performance peers are not U.S. public companies. •As a result, Corning looks to globally diversified companies or innovation companies in other industries to find companies of similar size and complexity. |
| 72 | CORNING 2024 PROXY STATEMENT |
Compensation Discussion & Analysis
We currently participate in and use several executive compensation surveys for NEO positions. Primary surveys are the Willis Towers Watson General Industry Executive Compensation Survey, the Equilar TrueView Survey and Aon Hewittthe Radford Total Compensation Measurement SurveyDatabase for Executives. These surveys provide general market data for relevant positions in companies with revenues and market capitalization similar to Corning’s in both the technology industry and in general industry.
20222023 Compensation Peer Group
Our 20222023 Compensation Peer Group is set forth below.
Given the growth of the Company over the past several years, in 2022 the Committee (with the assistance and advice of its consultant, Frederic W. Cook & Co., Inc.) reviewed and approved changes to the Compensation Peer Group removing two companies (Thermo Fischer Scientific and Broadcom) and adding seven new companies (Honeywell International, 3M Company, Illinois Tool Works, Emerson Electric, Amphenol Corporation, IQVIA Holdings and DuPont de Nemours). This had the net affecteffect of increasing the Compensation Peer Group from 21 companies to 26 companies with the goal of creating a data set of sufficient size which would not require further update for several years, outside of adjustments for peer M&A activity, etc. No changes were made to the Compensation Peer Group in 2023.
| 3M Company | Cummins Inc. | Illinois Tool Works, Inc. | PPG Industries, Inc. | |||
| Advanced Micro Devices, Inc. | Danaher Corporation | IQVIA Holdings, Inc. | QUALCOMM, Inc. | |||
| Agilent Technologies, Inc. | Dover Corporation | Juniper Networks, Inc. | Rockwell Automation, Inc. | |||
| Amphenol Corporation | DuPont de Nemours, Inc. | L3Harris Corporation | TE Connectivity Limited | |||
| Applied Materials, Inc. | Eaton Corporation PLC | Medtronic, Inc. | Texas Instruments Incorporated | |||
| BorgWarner, Inc. | Emerson Electric Co. | Motorola Solutions, Inc. | ||||
| Boston Scientific Corporation | Honeywell International Inc. | Net App, Inc. |
Compensation Discussion & Analysis
The Company utilizes a fair and challenging Compensation Peer Group as a reference point when setting its executive compensation. The Company’s ranking (using Core performance measures, where applicable) versus the Compensation Peer Group is indicated below.
COMPARISON, CORNING VERSUS COMPENSATION PEER GROUP
(in millions, except for Employees)
(in millions, except for Employees) | ||
| Revenue | Net Income | |
 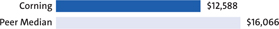 |  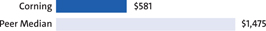 | |
Total Assets | Employees | |
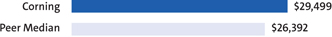  |  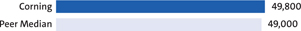 |
Corning uses the Compensation Peer Group solely as a reference point, in combination with broader executive compensation surveys, to assess each NEO’s target total direct compensation (i.e., base salary, STI and LTI target bonus, and the grant date fair value of long-term incentives). Our goal is to position our CEO’s target total direct compensation within a competitive range of the Compensation Peer Group median. Median target total direct CEO compensation in the Compensation Peer Group was determined to be $15.2$16.6 million, and 75th percentile target total direct CEO compensation was $18.6$20.2 million, compared with Corning target total direct CEO compensation of $16.7 million. The Committee deems this above-median market position for CEO pay to be appropriate given (a) Mr. Weeks’ strong performance in managing the complexity of the Company and (b) his years of experience in the role. Beyond the CEO, external data serves as a reference point, with internal equity and individual performance and impact being more important considerations in establishing a base salary and target total direct compensation for the other NEOs.
| CORNING 2024 PROXY STATEMENT | 73 |
Compensation Discussion & Analysis
Compensation Program – Other Governance Matters
Role of Compensation Consultant
The Committee has sole authority to retain and terminate its compensation consultant and to approve the consultant’s fees and all other terms of such engagement. Since 2014, the Committee has retained executive compensation experts from Frederic W. Cook & Co., Inc. (FW Cook).
In 2022,2023, FW Cook attended all Committee meetings. FW Cook advises the Committee on all matters related to NEO and director compensation and assists the Committee in interpreting its data as well as data and recommendations received from the Company.
In 2022,2023, the Company engaged Compensation Advisory Partners LLC (CAP) and Willis Towers Watson (WTW) to assist management and the Committee with various executive compensation matters.matters and disclosures.
The Committee conducted anreviewed the independence review of FW Cook, CAP and WTW pursuant to SEC and NYSE rules and concluded that theeach firm’s work of each firm for the Committee did not raise any conflicts of interest concerns. FW Cook provides no services to Corning other than the services rendered to the Committee.
Role of Executive Management in the Executive Compensation Process
Corning’s Chief Human Resources Officer and SVP, Global Compensation and Benefits, working closely with other members of Corning’s Human Resources, Law and Finance departments, are responsible for designing and implementing executive compensation programs and discussing with the Committee significant proposals or topics that affect executive compensation at the Company. The SVP, Global Compensation and Benefits, formulates the target total compensation recommendations for all executive officers (except the CEO) and reviews the recommendations for each of the other NEOs with the CEO. The NEOs do not recommend or suggest individual compensation actions that benefit them personally. The CEO may propose adjustments he deems appropriate before management’s recommendations are submitted to the Committee. Recommendations
Compensation Discussion & Analysis
for the CEO’s compensation are prepared by the Committee’s independent compensation consultant (FW Cook) and are not discussed or reviewed with the CEO prior to the Committee’s review and the CEO is not present for discussion of his compensation by the Committee. The Committee recommends the CEO’s compensation to the Board annually for approval.
After the annual budget is finalized each year, the Committee receives management’s recommendations for the annual bonus and long-term incentive plans performance metrics and sets the final targets for the year.
The CFO and the Corporate Controller attend the annual Committee meeting to review the CD&A and at least one of them attends the portion of the February Committee meeting where performance metrics are reviewed.
Clawback Policy
Our clawback policy givesThe Compensation and Talent Management Committee of the CommitteeBoard has adopted a formal Compensation Clawback Policy, as required by the sole and absolute discretion to make retroactive adjustments to any cashNYSE Listing Standards. The Clawback Policy provides for the recovery of incentive-based compensation erroneously received by current or equity-based incentive compensation paid toformer executive officers and other key employees if such payment was based uponduring the achievementthree fiscal years immediately preceding the year in which the company is required to prepare an accounting restatement due to material noncompliance with financial reporting requirements. The requirements under the Clawback Policy are separate from any recoupment required by the Sarbanes-Oxley Act of financial results that were subsequently the subject of a restatement.2002. The Committee also has discretion to seek recovery of any amount that it determines was received otherwise inappropriately by such individuals.
Anti-Hedging Policy
Our written insider trading policy, which governs trading activity by directors, officers and employees, prohibits employees and directors from selling or buying publicly traded options on Corning stock, or trading in any Corning stock derivatives. Additionally, these individuals may not engage in transactions in which they may profit from short-term speculative swings in the value of Corning stock utilizing “short sales” or “put” or “call” options.
Anti-Pledging Policy
Our written insider trading policy, which governs trading activity by directors, officers and employees, prohibits employees and directors from holding Corning stock in a margin account or pledging Company securities as collateral for a loan.
| 74 | CORNING 2024 PROXY STATEMENT |
Compensation Discussion & Analysis
Accounting Implications
In designing our compensation and benefitbenefits programs, we review the accounting implications of our decisions. We seek to deliver cost-effective compensation and benefit programs that meet both the needs of the Company and our employees.
Compensation and Talent Management Committee Report
The Compensation and Talent Management Committee of the Board of Directors (the Committee), which is composed entirely of independent directors, is responsible to the Board of Directors and our shareholders for the oversight and administration of executive compensation at Corning. The Committee approves the principles guiding the Company’s compensation philosophy, reviews and approves executive compensation levels (including cash compensation, equity incentives, benefits and perquisites for officers) and reports its actions to the Board of Directors for review and, as necessary, approval. The Committee is responsible for interpreting Corning’s executive compensation plans and programs. In the event of any questions or disputes, the Committee may use its judgment and/or discretion to make final administrative decisions regarding these plans and programs. It is our practice that all compensation decisions affecting a corporate officer must be reviewed and approved by the Committee. Additional details regarding the role and responsibilities of the Committee are defined in the Committee Charter, located in the Corporate Governance section of the Company’s website.
The Committee has reviewed and discussed the foregoing CD&A with management. Based on our review and discussions with management, we recommended to the Board of Directors that the CD&A be included in this proxy statement and in our Annual Report on Form 10-K, as appropriate, for the year ended December 31, 2022.2023.
The Compensation and Talent Management Committee:
Deborah D. Rieman, Chair
Leslie A. Brun
Richard T. Clark
Roger W. Ferguson, Jr.
Kurt M. Landgraf
Hansel E. Tookes II
Compensation Discussion & Analysis
20222023 Compensation Tables
20222023 Summary Compensation Table
This table describes the total compensation paid to our NEOs for fiscal years 2023, 2022 2021 and 2020,2021, as required. The components of the total compensation are described in the footnotes below and in more detail in the tables and narratives that follow. For information on the role of each component of compensation, see the description under “Compensation Discussion and Analysis.”
| (a) | (b) | (c) | (d)(1) | (e) | (f)(2) | (g)(3) | (h)(4) | (i) | ||||||||||||||||||
| Named Executive Officer | Year | Salary ($) | Stock Awards ($) | Option Awards ($) | Non-Equity Incentive Plan Compensation ($) | Change in Pension Value And Nonqualified Deferred Compensation Earnings ($) | All Other Compensation ($) | Total ($) | ||||||||||||||||||
| Wendell P. Weeks Chairman and Chief Executive Officer | 2022 | $ | 1,553,077 | $ | 10,661,224 | $ | 0 | $ | 3,479,983 | $ | 0 | $ | 475,185 | $ | 16,169,469 | |||||||||||
| 2021 | 1,492,648 | 8,023,645 | 0 | 10,820,127 | 0 | 429,612 | 20,766,032 | |||||||||||||||||||
| 2020 | 1,151,245 | 8,417,516 | 151,467 | 7,549,868 | 1,330,636 | 351,021 | 18,951,753 | |||||||||||||||||||
Edward A. Schlesinger Executive Vice President | 2022 | 641,085 | 1,232,451 | 0 | 530,850 | 0 | 62,099 | 2,466,485 | ||||||||||||||||||
| R. Tony Tripeny Former Executive Vice President and Chief Financial Officer | 2022 | 292,308 | 2,307,528 | 0 | 541,084 | 0 | 124,630 | 3,265,550 | ||||||||||||||||||
| 2021 | 748,721 | 1,817,807 | 0 | 2,947,452 | 414,876 | 107,010 | 6,035,866 | |||||||||||||||||||
| 2020 | 593,210 | 2,098,154 | 54,636 | 1,829,521 | 702,995 | 95,859 | 5,374,375 | |||||||||||||||||||
| Lawrence D. McRae Vice Chairman and Corporate Development Officer | 2022 | 865,585 | 2,404,366 | 0 | 974,452 | 0 | 184,143 | 4,428,546 | ||||||||||||||||||
| 2021 | 833,604 | 1,897,383 | 0 | 3,010,569 | 0 | 79,247 | 5,820,803 | |||||||||||||||||||
| 2020 | 687,804 | 2,400,779 | 63,336 | 2,019,691 | 471,510 | 48,505 | 5,691,625 | |||||||||||||||||||
| Eric S. Musser President and Chief Operating Officer | 2022 | 913,523 | 3,659,339 | 0 | 1,379,649 | 0 | 115,315 | 6,067,826 | ||||||||||||||||||
| 2021 | 870,837 | 2,630,873 | 0 | 3,761,798 | 163,366 | 86,427 | 7,513,301 | |||||||||||||||||||
| 2020 | 645,040 | 2,616,593 | 65,598 | 1,917,331 | 427,990 | 80,943 | 5,753,495 | |||||||||||||||||||
| Lewis A. Steverson Executive Vice President and Chief Legal and Administration Officer | 2022 | 837,369 | 3,007,811 | 0 | 1,083,552 | 0 | 198,904 | 5,127,636 | ||||||||||||||||||
| 2021 | 780,288 | 2,228,528 | 0 | 2,751,037 | 442,144 | 115,660 | 6,317,657 | |||||||||||||||||||
| As part of the 2023 Cash for Equity Exchange Program, 2023 cash PIP was exchanged for PSUs granted on February 8, 2023. Such PSUs, at target, are included in the Stock Awards column below. However, the PSUs were only earned (and paid out) at 51% of target. Unearned PSUs were forfeited and cancelled. |
| (a) | (b) | (c)(1) | (d)(2) | (e) | (f)(3) | (g)(4) | (h)(5) | (i) | ||||||||||
| Named Executive Officer | Year | Salary ($) | Stock Awards ($) | Option Awards ($) | Non-Equity Incentive Plan Compensation ($) | Change in Pension Value And Nonqualified Deferred Compensation Earnings ($) | All Other Compensation ($) | Total ($) | ||||||||||
| Wendell P. Weeks | 2023 | $1,580,000 | $11,355,517 | $0 | $ 1,968,325 | $329,695 | $394,116 | $15,627,653 | ||||||||||
| Chairman and Chief | 2022 | 1,553,077 | 10,661,224 | 0 | 3,479,983 | 0 | 475,185 | 16,169,469 | ||||||||||
| Executive Officer | 2021 | 1,492,648 | 8,023,645 | 0 | 10,820,127 | 0 | 429,612 | 20,766,032 | ||||||||||
| Edward A. Schlesinger | 2023 | 650,000 | 2,056,577 | 0 | 281,601 | 509,115 | 68,921 | 3,566,214 | ||||||||||
| Executive Vice President | 2022 | 641,085 | 1,232,451 | 0 | 530,850 | 0 | 62,099 | 2,466,485 | ||||||||||
| and Chief Financial Officer | ||||||||||||||||||
| Lawrence D. McRae(6) | 2023 | 880,500 | 2,611,344 | 0 | 449,464 | 109,596 | 156,709 | 4,207,613 | ||||||||||
| Vice Chairman and Corporate | 2022 | 865,585 | 2,404,366 | 0 | 974,452 | 0 | 184,143 | 4,428,546 | ||||||||||
| Development Officer | 2021 | 833,604 | 1,897,383 | 0 | 3,010,569 | 0 | 79,247 | 5,820,803 | ||||||||||
| Eric S. Musser | 2023 | 929,300 | 4,655,565 | 0 | 738,207 | 249,101 | 144,382 | 6,716,555 | ||||||||||
| President and Chief | 2022 | 913,523 | 3,659,339 | 0 | 1,379,649 | 0 | 115,315 | 6,067,826 | ||||||||||
| Operating Officer | 2021 | 870,837 | 2,630,873 | 0 | 3,761,798 | 163,366 | 86,427 | 7,513,301 | ||||||||||
| Lewis A. Steverson | 2023 | 851,800 | 3,500,556 | 0 | 608,457 | 702,772 | 96,931 | 5,760,516 | ||||||||||
| Executive Vice President | 2022 | 837,369 | 3,007,811 | 0 | 1,083,552 | 0 | 198,904 | 5,127,636 | ||||||||||
| and Chief Legal and | 2021 | 780,288 | 2,228,528 | 0 | 2,751,037 | 442,144 | 115,660 | 6,317,657 | ||||||||||
| Administration Officer |
| (1) | |
| (2) | The amounts in the Stock Awards column reflect the aggregate grant date fair value computed in accordance with FASB ASC Topic 718 of awards of |
| (3) | The amounts in the Non-Equity Incentive Plan Compensation column reflect the sum of annual short-term incentive payments |
| Named Executive Officer | Year End Base Salary | 2022 PIP Target % | Actual 2022 PIP Performance Results (% Tgt.) | (A) 2022 PIP $ Award | Actual 2022 GoalSharing Performance % | (B) 2022 GoalSharing $ Award | ||||||||||
| Wendell P. Weeks | $ | 1,580,000 | 150% | 62.5% | $ | 1,481,250 | 5.65% | $ | 89,270 | |||||||
| Edward A. Schlesinger | 650,000 | 80% | 62.5% | 325,000 | 5.65% | 36,725 | ||||||||||
| R. Tony Tripeny | 800,000 | 95% | 62.5% | 156,275 | 5.65% | 14,871 | ||||||||||
| Lawrence D. McRae | 880,500 | 85% | 62.5% | 467,767 | 5.65% | 49,748 | ||||||||||
| Eric S. Musser | 929,300 | 120% | 62.5% | 696,975 | 5.65% | 52,505 | ||||||||||
| Lewis A. Steverson | 851,800 | 95% | 62.5% | 505,756 | 5.65% | 48,127 | ||||||||||
| Named Executive Officer | 2023 Year End Base Salary | 2023 PIP Target % | Actual 2023 PIP Performance (% Target) | (A) 2023 PIP $ Award | Actual 2023 GoalSharing Payout (% base) | (B) 2023 GoalSharing $ Award | ||||||
| Wendell P. Weeks | $1,580,000 | 150% | 51.00% | N/A | 5.48% | $86,584 | ||||||
| Edward A. Schlesinger | 650,000 | 90% | 51.00% | N/A | 5.48% | 35,620 | ||||||
| Lawrence D. McRae | 880,500 | 85% | 51.00% | N/A | 5.48% | 48,251 | ||||||
| Eric S. Musser | 929,300 | 140% | 51.00% | N/A | 5.48% | 50,926 | ||||||
| Lewis A. Steverson | 851,800 | 95% | 51.00% | N/A | 5.48% | 46,679 |
| 76 | CORNING |
Compensation Discussion & Analysis
In addition to the 20222023 GoalSharing and PIP awards noted above, the amounts in column (f) also reflect the earned portions of CPU Awards granted in 2023, 2022 2021 and 20202021 on the basis of 20222023 performance against established measures. 20222023 CPU award payouts will be made in February 20252026 based on actual corporate performance compared to the established performance goals averaged over three years (2022, 2023(2023, 2024 and 2024)2025) and subject to a ±10% 3-year ROIC modifier as described starting on page 70.68. 2022 and 2021 and 2020 CPU award payouts are based on performance goals averaged over three years (2022, 2023 and 2024) and (2021, 2022 and 2023) and (2020, 2021 and 2022), respectively, and are also subject to a ±10% 3-year ROIC modifier. Performance goals for 20232024 and 20242025 are yet to be established. While the final payout amounts for 20222023 and 20212022 CPU awards are unknown, the table below reflects the earned amount of 2023, 2022 2021 and 20202021 CPU awards, which are reflected in column (f) above on the basis of 20222023 performance metrics, and which exclude the portion of the 20222023 award that remains unearned as a result of the 3-year performance modifier that is not yet known. The 3-year ROIC modifier for the period 2020-20222021-2023 is +10%+2.5%, so the adjustment in the Summary Compensation Table as a result of this modifier is noted below since the amount “at risk” was previously unreported until final performance was known. Mr. Tripeny’s 2022 CPU target is prorated to reflect time worked in 2022 prior to his retirement on April 30, 2022.
| Named Executive Officer | 2022 LTI Target ($) | 2022 CPU Target Award ($) | 2022 CPU Performance Results % | (C) Prorated Earned 2022 CPU Award Based on 2022 Performance (Year One of Three) ($)* | 2021 CPU Target Award ($) | (D) Prorated Earned 2021 CPU Award Based on 2022 Performance (Year Two of Three) ($)* | 2020 CPU Target Award ($) | (E) Prorated Earned 2020 CPU Award Based on 2022 Performance (Year Three of Three) ($)* | (F) Prorated Earned 2020 CPU Award Based on 2020 - 2022 ROIC Modifier** ($) | |||||||||||||||||||||
| Wendell P. Weeks | $ | 12,650,000 | $ | 3,162,500 | 49 | % | $ | 464,888 | $ | 2,912,500 | $ | 428,138 | $ | 2,437,500 | $ | 358,313 | $ | 658,124 | ||||||||||||
| Edward A. Schlesinger | 2,000,000 | 500,000 | 49 | % | 73,500 | 225,000 | 33,075 | 150,000 | 22,050 | 40,500 | ||||||||||||||||||||
| R. Tony Tripeny | 2,550,000 | 212,500 | 49 | % | 31,238 | 637,500 | 93,713 | 587,500 | 86,363 | 158,624 | ||||||||||||||||||||
| Lawrence D. McRae | 2,600,000 | 650,000 | 49 | % | 95,550 | 650,000 | 95,550 | 637,500 | 93,713 | 172,124 | ||||||||||||||||||||
| Eric S. Musser | 4,750,000 | 1,187,500 | 49 | % | 174,563 | 1,025,000 | 150,675 | 731,250 | 107,494 | 197,437 | ||||||||||||||||||||
| Lewis A. Steverson | 3,800,000 | 950,000 | 49 | % | 139,650 | 862,500 | 126,788 | 631,250 | 92,794 | 170,437 | ||||||||||||||||||||
| Named Executive Officer | 2023 LTI Target ($) | 2023 CPU Target Award ($) | 2023 CPU Performance Results % | (C) Prorated Earned 2023 CPU Award Based on 2023 Performance (Year One of Three) ($)* | 2022 CPU Target Award ($) | (D) Prorated Earned 2022 CPU Award Based on 2023 Performance (Year Two of Three) ($)* | 2021 CPU Target Award ($) | (E) Prorated Earned 2021 CPU Award Based on 2023 Performance (Year Three of Three) ($)* | (F) Prorated Earned 2021 CPU Award Based on 2021 - 2023 ROIC Modifier** ($) | |||||||||||||||||||||
| Wendell P. Weeks | $ | 12,650,000 | $ | 3,162,500 | 56 | % | $531,300 | $ | 3,162,500 | $531,300 | $ | 2,912,500 | $489,300 | $329,841 | ||||||||||||||||
| Edward A. Schlesinger | 2,350,000 | 587,500 | 56 | % | 98,700 | 500,000 | 84,000 | 225,000 | 37,800 | 25,481 | ||||||||||||||||||||
| Lawrence D. McRae | 2,600,000 | 650,000 | 56 | % | 109,200 | 650,000 | 109,200 | 650,000 | 109,200 | 73,613 | ||||||||||||||||||||
| Eric S. Musser | 4,750,000 | 1,187,500 | 56 | % | 199,500 | 1,187,500 | 199,500 | 1,025,000 | 172,200 | 116,081 | ||||||||||||||||||||
| Lewis A. Steverson | 3,800,000 | 950,000 | 56 | % | 159,600 | 950,000 | 159,600 | 862,500 | 144,900 | 97,678 | ||||||||||||||||||||
| * | each annual portion is reduced by 10% before applying the annual performance factor since this 10% is subject to the 3-year ROIC modifier which result is not known until the end of the 3-year performance period |
| ** |
The amount disclosed in column (f) consists of the total (A) + (B) + (C) + (D) + (E) + (F) shown in this footnote (2).
(3)(4) The amounts in column (g) reflect the increase in the actuarial present value of the NEOs’ benefits under all defined benefit pension plans established by the Company determined using interest rate and mortality rate assumptions consistent with those used in the Company’s financial statements. Although column (g) is also used to report the amount of above marketabove-market earnings on compensation that is deferred under the nonqualified deferred compensation plan, Corning does not have any above marketabove-market earnings under its nonqualified deferred compensation plan, also referred to as the Supplemental Investment Plan. In 20222023, the discount rate used to value the actuarial liability increaseddecreased approximately 26134 basis points from 2.88%5.49% to 5.49%5.15%. This change resulted in a decreasean increase in the present value of pension benefits for all NEOs, which results in zero value reported in the Summary Compensation Table.NEOs. Discount rate changes over the past several years have resulted in significant year-to-year fluctuations in the present value of pension benefits as shown below:
| Named Executive Officer | 2022 Present Value of Pension Benefits ($) | 2021 Present Value of Pension Benefits ($) | 2020 Present Value of Pension Benefits ($) | 2019 Present Value of Pension Benefits ($) | ||
| Wendell P. Weeks | $26,043,339 | $31,472,765 | $33,561,304 | $32,230,668 | ||
| Edward A. Schlesinger | 1,522,479 | ------------------------------------ Not a NEO ------------------------------------ | ||||
| R. Tony Tripeny | 8,465,105 | 9,949,343 | 9,534,467 | 8,831,472 | ||
| Lawrence D. McRae | 10,271,836 | 12,187,537 | 12,749,428 | 12,277,918 | ||
| Eric S. Musser | 10,512,844 | 11,147,934 | 10,984,568 | Not a NEO | ||
| Lewis A. Steverson | 3,490,589 | 3,555,981 | ------------------- Not a NEO ------------------- | |||
| Valuation Discount Rate | 5.49% | 2.88% | 2.52% | 3.31% | ||
| Named Executive Officer | 2023 Present Value of Pension Benefits ($) | 2022 Present Value of Pension Benefits ($) | 2021 Present Value of Pension Benefits ($) | 2020 Present Value of Pension Benefits ($) | ||
| Wendell P. Weeks | $26,373,034 | $26,043,339 | $31,472,765 | $33,561,304 | ||
| Edward A. Schlesinger | 2,031,594 | 1,522,479 | ------------------- Not a NEO ------------------- | |||
| Lawrence D. McRae | 10,381,432 | 10,271,836 | 12,187,537 | 12,749,428 | ||
| Eric S. Musser | 10,761,945 | 10,512,844 | 11,147,934 | 10,984,568 | ||
| Lewis A. Steverson | 4,193,361 | 3,490,589 | 3,555,981 | -- Not a NEO -- | ||
| Valuation Discount Rate | 5.15% | 5.49% | 2.88% | 2.52% | ||
Compensation Discussion & Analysis
| The following table shows “All Other Compensation” amounts provided to the NEOs in |
| Named Executive Officer | Company Match on Qualified 401(k) Plan | Company Match on Supplemental Investment Plan | Value of Personal Aircraft Rights(i) | Value of Home Security Costs and Financial Counseling (ii) | Other(iii) | Total All Other Compensation | ||||||||||||||
| Wendell P. Weeks | $ | 11,115 | $ | 84,788 | $ | 207,133 | $ | 157,934 | (iv) | $ | 14,215 | $ | 475,185 | |||||||
| Edward A. Schlesinger | 12,200 | 30,402 | 15,163 | 1,425 | 2,909 | 62,099 | ||||||||||||||
| R. Tony Tripeny | 0 | 52,541 | 5,464 | 58,716 | 7,909 | 124,630 | ||||||||||||||
| Lawrence D. McRae | 6,669 | 124,555 | 48,425 | 4,085 | 409 | 184,143 | ||||||||||||||
| Eric S. Musser | 18,834 | 0 | 86,058 | 0 | 10,423 | 115,315 | ||||||||||||||
| Lewis A. Steverson | 5,400 | 76,833 | 107,751 | 4,090 | 4,830 | 198,904 | ||||||||||||||
| Named Executive Officer | Company Match on Qualified 401(k) Plan | Company Match on Supplemental Investment Plan | Value of Personal Aircraft Rights(i) | Value of Home Security Costs and Financial Counseling(ii) | Other(iii) | Total All Other Compensation | |||||||||||
| Wendell P. Weeks | $10,377 | $67,545 | $154,607 | $148,166 | (iv) | $13,421 | $394,116 | ||||||||||
| Edward A. Schlesinger | 13,757 | 24,019 | 22,949 | 4,102 | 4,094 | 68,921 | |||||||||||
| Lawrence D. McRae | 4,800 | 77,558 | 69,666 | 4,295 | 390 | 156,709 | |||||||||||
| Eric S. Musser | 13,200 | 0 | 125,672 | 0 | 5,510 | 144,382 | |||||||||||
| Lewis A. Steverson | 0 | 22,155 | 68,642 | 5,745 | 389 | 96,931 | |||||||||||
| (i) | Amounts shown above reflect aircraft usage during |
| (ii) | NEOs may use their executive allowance for residential security or financial counseling services. |
| (iii) | These amounts include costs attributable to executive physicals, including associated travel costs, an annual Board gift, and contributions made under the Corning Foundation Matching Gifts Program. |
| (iv) | This reflects Company-paid expenses relating to personal and residential security benefitting Mr. Weeks and, through association, his family. Mr. Weeks’ personal safety and security are of vital importance to the Company’s business and prospects, and the Board considers these costs to be appropriate. However, because these costs can be viewed as conveying a personal benefit to Mr. Weeks, they are reported as perquisites in this column. |
| (6) | Mr. McRae retired as of December 31, 2023. |
| 78 | CORNING 2024 PROXY STATEMENT |
Compensation Discussion & Analysis
2023 Grants of Plan-Based Awards
| Estimated Future Payouts Under Non-Equity Incentive Plan Awards | Estimated Future Payouts Under Equity Incentive Plan Awards | ||||||||||||||||||||||||||||||
| (a) | (b) | (c) | (d)(1) | (e)(1) | (f)(1) | (g)(2) | (h)(2) | (i)(2) | (j) | (k) | (l) | ||||||||||||||||||||
| Named Executive Officer | Award | Grant Date | Date of Committee Action | Threshold ($) | Target ($) | Maximum ($) | Threshold (#) | Target (#) | Maximum (#) | All Other Stock Awards: Number of Shares of Stock or Units (#) | Closing Market Price on Date of Grant ($/Sh) | Grant Date Fair Value of Stock and Option Awards ($) | |||||||||||||||||||
| Wendell P. Weeks | Cash for Equity - PIP Exchange PSUs | 2/8/23 | 0 | 67,445 | 74,190 | 35.14 | 2,370,017 | (3) | |||||||||||||||||||||||
| GoalSharing Plan | n/a | 0 | 79,000 | 158,000 | |||||||||||||||||||||||||||
| Cash for Equity - Salary Exchange RSUs | 2/8/23 | 10,792 | 35.14 | 379,231 | (4) | ||||||||||||||||||||||||||
| Cash Performance Units | 2/8/23 | 2/8/23 | 0 | 3,162,500 | 6,957,500 | ||||||||||||||||||||||||||
| 2021 Performance Share Units | 2/8/23 | 2/8/23 | 0 | 39,725 | 87,395 | 35.14 | 1,395,937 | (5) | |||||||||||||||||||||||
| 2022 Performance Share Units | 2/8/23 | 2/8/23 | 0 | 52,186 | 114,809 | 35.14 | 1,833,816 | (6) | |||||||||||||||||||||||
| 2023 Performance Share Units | 4/3/23 | 2/8/23 | 0 | 54,292 | 119,442 | 34.95 | 1,897,505 | (7) | |||||||||||||||||||||||
| Time-Based Restricted Stock Units | 4/3/23 | 2/8/23 | 108,584 | 34.95 | 3,795,011 | (8) | |||||||||||||||||||||||||
| Edward A. Schlesinger | Cash for Equity - PIP Exchange PSUs | 2/8/23 | 0 | 16,648 | 18,313 | 35.14 | 585,011 | (3) | |||||||||||||||||||||||
| GoalSharing Plan | n/a | 0 | 32,500 | 65,000 | |||||||||||||||||||||||||||
| Cash for Equity - Salary Exchange RSUs | 2/8/23 | 2,775 | 35.14 | 97,514 | (4) | ||||||||||||||||||||||||||
| Cash Performance Units | 2/8/23 | 2/8/23 | 0 | 587,500 | 1,292,500 | ||||||||||||||||||||||||||
| 2021 Performance Share Units | 2/8/23 | 2/8/23 | 0 | 3,069 | 6,752 | 35.14 | 107,845 | (5) | |||||||||||||||||||||||
| 2022 Performance Share Units | 2/8/23 | 2/8/23 | 0 | 8,251 | 18,152 | 35.14 | 289,940 | (6) | |||||||||||||||||||||||
| 2023 Performance Share Units | 4/3/23 | 2/8/23 | 0 | 10,086 | 22,189 | 34.95 | 352,506 | (7) | |||||||||||||||||||||||
| Time-Based Restricted Stock Units | 4/3/23 | 2/8/23 | 20,172 | 34.95 | 705,011 | (8) | |||||||||||||||||||||||||
| CORNING 2024 PROXY STATEMENT | 79 |
Compensation Discussion & Analysis
2022 Grants of Plan-Based Awards
| Estimated Future Payouts Under Non-Equity Incentive Plan Awards | Estimated Future Payouts Under Equity Incentive Plan Awards | ||||||||||||||||||||||||||||||
| (a) | (b) | (c) | (d)(1) | (e)(1) | (f)(1) | (g)(2) | (h)(2) | (i)(2) | (j) | (k) | (l) | ||||||||||||||||||||
| Named Executive Officer | Award | Grant Date | Date of Committee Action | Threshold ($) | Target ($) | Maximum ($) | Threshold (#) | Target (#) | Maximum (#) | All Other Stock Awards: Number of Shares of Stock or Units (#) | Closing Market Price on Date of Grant ($/Sh) | Grant Date Fair Value of Stock Awards ($) | |||||||||||||||||||
| Wendell P. Weeks | Performance Incentive Plan | n/a | 0 | 2,370,000 | 4,740,000 | ||||||||||||||||||||||||||
| GoalSharing Plan | n/a | 0 | 79,000 | 158,000 | |||||||||||||||||||||||||||
| Cash Performance Units | 2/2/22 | 2/1/22 | 0 | 3,162,500 | 6,957,500 | ||||||||||||||||||||||||||
| 2020 Performance Share Units | 2/2/22 | 2/1/22 | 0 | 76,530 | 168,366 | 42.74 | 3,270,892 | (3) | |||||||||||||||||||||||
| 2021 Performance Share Units | 2/2/22 | 2/1/22 | 0 | 39,725 | 87,395 | 42.74 | 1,697,847 | (4) | |||||||||||||||||||||||
| 2022 Performance Share Units | 4/1/22 | 2/1/22 | 0 | 52,186 | 114,809 | 36.36 | 1,897,483 | (5) | |||||||||||||||||||||||
| Time-Based Restricted Stock Units | 4/1/22 | 2/1/22 | 104,373 | 36.36 | 3,795,002 | (6) | |||||||||||||||||||||||||
| Edward A. Schlesinger | Performance Incentive Plan | n/a | 0 | 520,000 | 1,040,000 | ||||||||||||||||||||||||||
| GoalSharing Plan | n/a | 0 | 32,500 | 65,000 | |||||||||||||||||||||||||||
| Cash Performance Units | 2/2/22 | 2/1/22 | 0 | 500,000 | 1,100,000 | ||||||||||||||||||||||||||
| 2020 Performance Share Units | 2/2/22 | 2/1/22 | 0 | 4,709 | 10,360 | 42.74 | 201,263 | (3) | |||||||||||||||||||||||
| 2021 Performance Share Units | 2/2/22 | 2/1/22 | 0 | 3,069 | 6,752 | 42.74 | 131,169 | (4) | |||||||||||||||||||||||
| 2022 Performance Share Units | 4/1/22 | 2/1/22 | 0 | 8,251 | 18,152 | 36.36 | 300,006 | (5) | |||||||||||||||||||||||
| Time-Based Restricted Stock Units | 4/1/22 | 2/1/22 | 16,502 | 36.36 | 600,013 | (6) | |||||||||||||||||||||||||
| R. Tony Tripeny7 | Performance Incentive Plan | n/a | 0 | 760,000 | 1,520,000 | ||||||||||||||||||||||||||
| GoalSharing Plan | n/a | 0 | 40,000 | 80,000 | |||||||||||||||||||||||||||
| Cash Performance Units | 2/2/22 | 2/1/22 | 0 | 637,500 | 1,402,500 | ||||||||||||||||||||||||||
| 2020 Performance Share Units | 2/2/22 | 2/1/22 | 0 | 18,446 | 40,581 | 42.74 | 788,382 | (3) | |||||||||||||||||||||||
| 2021 Performance Share Units | 2/2/22 | 2/1/22 | 0 | 8,695 | 19,129 | 42.74 | 371,624 | (4) | |||||||||||||||||||||||
| 2022 Performance Share Units | 4/1/22 | 2/1/22 | 0 | 10,520 | 23,144 | 36.36 | 382,507 | (5) | |||||||||||||||||||||||
| Time-Based Restricted Stock Units | 4/1/22 | 2/1/22 | 21,040 | 36.36 | 765,014 | (6) | |||||||||||||||||||||||||
| Estimated Future Payouts Under Non-Equity Incentive Plan Awards | Estimated Future Payouts Under Equity Incentive Plan Awards | ||||||||||||||||||||||||||||||
| (a) | (b) | (c) | (d)(1) | (e)(1) | (f)(1) | (g)(2) | (h)(2) | (i)(2) | (j) | (k) | (l) | ||||||||||||||||||||
| Named Executive Officer | Award | Grant Date | Date of Committee Action | Threshold ($) | Target ($) | Maximum ($) | Threshold (#) | Target (#) | Maximum (#) | All Other Stock Awards: Number of Shares of Stock or Units (#) | Closing Market Price on Date of Grant ($/Sh) | Grant Date Fair Value of Stock and Option Awards ($) | |||||||||||||||||||
| Lawrence D. McRae | Cash for Equity - PIP Exchange PSUs | 2/8/23 | 0 | 21,299 | 23,429 | 35.14 | 748,447 | (3) | |||||||||||||||||||||||
| GoalSharing Plan | n/a | 0 | 44,025 | 88,050 | |||||||||||||||||||||||||||
| Cash for Equity - Salary Exchange RSUs | 2/8/23 | 752 | 35.14 | 26,425 | (4) | ||||||||||||||||||||||||||
| Cash Performance Units | 2/8/23 | 2/8/23 | 0 | 650,000 | 1,430,000 | ||||||||||||||||||||||||||
| 2021 Performance Share Units | 2/8/23 | 2/8/23 | 0 | 8,866 | 19,505 | 35.14 | 311,551 | (5) | |||||||||||||||||||||||
| 2022 Performance Share Units | 2/8/23 | 2/8/23 | 0 | 10,726 | 23,597 | 35.14 | 376,912 | (6) | |||||||||||||||||||||||
| 2023 Performance Share Units | 4/3/23 | 2/8/23 | 0 | 11,159 | 24,550 | 34.95 | 390,007 | (7) | |||||||||||||||||||||||
| Time-Based Restricted Stock Units | 4/3/23 | 2/8/23 | 22,318 | 34.95 | 780,014 | (8) | |||||||||||||||||||||||||
| Eric S. Musser | Cash for Equity - PIP Exchange PSUs | 2/8/23 | 0 | 37,024 | 40,726 | 35.14 | 1,301,023 | (3) | |||||||||||||||||||||||
| GoalSharing Plan | n/a | 0 | 46,465 | 92,930 | |||||||||||||||||||||||||||
| Cash for Equity - Salary Exchange RSUs | 2/8/23 | 6,347 | 35.14 | 223,034 | (4) | ||||||||||||||||||||||||||
| Cash Performance Units | 2/8/23 | 2/8/23 | 0 | 1,187,500 | 2,612,500 | ||||||||||||||||||||||||||
| 2021 Performance Share Units | 2/8/23 | 2/8/23 | 0 | 13,980 | 30,756 | 35.14 | 491,257 | (5) | |||||||||||||||||||||||
| 2022 Performance Share Units | 2/8/23 | 2/8/23 | 0 | 19,596 | 43,111 | 35.14 | 688,603 | (6) | |||||||||||||||||||||||
| 2023 Performance Share Units | 4/3/23 | 2/8/23 | 0 | 20,386 | 44,849 | 34.95 | 712,491 | (7) | |||||||||||||||||||||||
| Time-Based Restricted Stock Units | 4/3/23 | 2/8/23 | 40,773 | 34.95 | 1,425,016 | (8) | |||||||||||||||||||||||||
| 80 | CORNING |
Compensation Discussion & Analysis
| Estimated Future Payouts Under Non-Equity Incentive Plan Awards | Estimated Future Payouts Under Equity Incentive Plan Awards | ||||||||||||||||||||||||||||||
| (a) | (b) | (c) | (d)(1) | (e)(1) | (f)(1) | (g)(2) | (h)(2) | (i)(2) | (j) | (k) | (l) | ||||||||||||||||||||
| Named Executive Officer | Award | Grant Date | Date of Committee Action | Threshold ($) | Target ($) | Maximum ($) | Threshold (#) | Target (#) | Maximum (#) | All Other Stock Awards: Number of Shares of Stock or Units (#) | Closing Market Price on Date of Grant ($/Sh) | Grant Date Fair Value of Stock Awards ($) | |||||||||||||||||||
| Lawrence D. McRae | Performance Incentive Plan | n/a | 0 | 748,425 | 1,496,850 | ||||||||||||||||||||||||||
| GoalSharing Plan | n/a | 0 | 44,025 | 88,050 | |||||||||||||||||||||||||||
| Cash Performance Units | 2/2/22 | 2/1/22 | 0 | 650,000 | 1,430,000 | ||||||||||||||||||||||||||
| 2020 Performance Share Units | 2/2/22 | 2/1/22 | 0 | 20,015 | 44,033 | 42.74 | 855,441 | (3) | |||||||||||||||||||||||
| 2021 Performance Share Units | 2/2/22 | 2/1/22 | 0 | 8,866 | 19,505 | 42.74 | 378,933 | (4) | |||||||||||||||||||||||
| 2022 Performance Share Units | 4/1/22 | 2/1/22 | 0 | 10,726 | 23,597 | 36.36 | 389,997 | (5) | |||||||||||||||||||||||
| Time-Based Restricted Stock Units | 4/1/22 | 2/1/22 | 21,452 | 36.36 | 779,995 | (6) | |||||||||||||||||||||||||
| Eric S. Musser | Performance Incentive Plan | n/a | 0 | 1,115,160 | 2,230,320 | ||||||||||||||||||||||||||
| GoalSharing Plan | n/a | 0 | 46,465 | 92,930 | |||||||||||||||||||||||||||
| Cash Performance Units | 2/2/22 | 2/1/22 | 0 | 1,187,500 | 2,612,500 | ||||||||||||||||||||||||||
| 2020 Performance Share Units | 2/2/22 | 2/1/22 | 0 | 18,446 | 40,581 | 42.74 | 788,382 | (3) | |||||||||||||||||||||||
| 2020 Performance Share Units | 2/2/22 | 2/1/22 | 0 | 3,181 | 6,998 | 42.74 | 135,956 | (3) | |||||||||||||||||||||||
| 2021 Performance Share Units | 2/2/22 | 2/1/22 | 0 | 13,980 | 30,756 | 42.74 | 597,505 | (4) | |||||||||||||||||||||||
| 2022 Performance Share Units | 4/1/22 | 2/1/22 | 0 | 19,596 | 43,111 | 36.36 | 712,511 | (5) | |||||||||||||||||||||||
| Time-Based Restricted Stock Units | 4/1/22 | 2/1/22 | 39,191 | 36.36 | 1,424,985 | (6) | |||||||||||||||||||||||||
| Estimated Future Payouts Under Non-Equity Incentive Plan Awards | Estimated Future Payouts Under Equity Incentive Plan Awards | ||||||||||||||||||||||||||||||
| (a) | (b) | (c) | (d)(1) | (e)(1) | (f)(1) | (g)(2) | (h)(2) | (i)(2) | (j) | (k) | (l) | ||||||||||||||||||||
| Named Executive Officer | Award | Grant Date | Date of Committee Action | Threshold ($) | Target ($) | Maximum ($) | Threshold (#) | Target (#) | Maximum (#) | All Other Stock Awards: Number of Shares of Stock or Units (#) | Closing Market Price on Date of Grant ($/Sh) | Grant Date Fair Value of Stock and Option Awards ($) | |||||||||||||||||||
| Lewis A. Steverson | Cash for Equity - PIP Exchange PSUs | 2/8/23 | 0 | 23,029 | 25,332 | 35.14 | 809,239 | (3) | |||||||||||||||||||||||
| GoalSharing Plan | n/a | 0 | 42,590 | 85,180 | |||||||||||||||||||||||||||
| Cash for Equity - Salary Exchange RSUs | 2/8/23 | 2,909 | 35.14 | 102,222 | (4) | ||||||||||||||||||||||||||
| Cash Performance Units | 2/8/23 | 2/8/23 | 0 | 950,000 | 2,090,000 | ||||||||||||||||||||||||||
| 2021 Performance Share Units | 2/8/23 | 2/8/23 | 0 | 11,764 | 25,881 | 35.14 | 413,387 | (5) | |||||||||||||||||||||||
| 2022 Performance Share Units | 2/8/23 | 2/8/23 | 0 | 15,677 | 34,489 | 35.14 | 550,890 | (6) | |||||||||||||||||||||||
| 2023 Performance Share Units | 4/3/23 | 2/8/23 | 0 | 16,309 | 35,880 | 34.95 | 570,000 | (7) | |||||||||||||||||||||||
| Time-Based Restricted Stock Units | 4/3/23 | 2/8/23 | 32,618 | 34.95 | 1,139,999 | (8) | |||||||||||||||||||||||||
Compensation Discussion & Analysis
| Estimated Future Payouts Under Non-Equity Incentive Plan Awards | Estimated Future Payouts Under Equity Incentive Plan Awards | ||||||||||||||||||||||||||||||
| (a) | (b) | (c) | (d)(1) | (e)(1) | (f)(1) | (g)(2) | (h)(2) | (i)(2) | (j) | (k) | (l) | ||||||||||||||||||||
| Named Executive Officer | Award | Grant Date | Date of Committee Action | Threshold ($) | Target ($) | Maximum ($) | Threshold (#) | Target (#) | Maximum (#) | All Other Stock Awards: Number of Shares of Stock or Units (#) | Closing Market Price on Date of Grant ($/Sh) | Grant Date Fair Value of Stock Awards ($) | |||||||||||||||||||
| Lewis A. Steverson | Performance Incentive Plan | n/a | 0 | 809,210 | 1,618,420 | ||||||||||||||||||||||||||
| GoalSharing Plan | n/a | 0 | 42,590 | 85,180 | |||||||||||||||||||||||||||
| Cash Performance Units | 2/2/22 | 2/1/22 | 0 | 950,000 | 2,090,000 | ||||||||||||||||||||||||||
| 2020 Performance Share Units | 2/2/22 | 2/1/22 | 0 | 15,698 | 34,536 | 42.74 | 670,933 | (3) | |||||||||||||||||||||||
| 2020 Performance Share Units | 2/2/22 | 2/1/22 | 0 | 2,903 | 6,387 | 42.74 | 124,074 | (3) | |||||||||||||||||||||||
| 2021 Performance Share Units | 2/2/22 | 2/1/22 | 0 | 11,764 | 25,881 | 42.74 | 502,793 | (4) | |||||||||||||||||||||||
| 2022 Performance Share Units | 4/1/22 | 2/1/22 | 0 | 15,677 | 34,489 | 36.36 | 570,016 | (5) | |||||||||||||||||||||||
| Time-Based Restricted Stock Units | 4/1/22 | 2/1/22 | 31,353 | 36.36 | 1,139,995 | (6) | |||||||||||||||||||||||||
| (1) | The amounts shown in columns (d), (e) and (f) reflect the award amounts under (i) the |
| (2) | The amounts shown in columns (g), (h) and (i) reflect the award amounts under the 2023 Cash for Equity PIP exchange for PSUs (see footnote 3), the Performance |
| (3) | These amounts reflect the |
| (4) |
| (5) | These amounts reflect the total grant date fair value computed in accordance with FASB ASC Topic 718 of the portion of the 2021 PSUs pursuant to the Corning 2012 Long-Term Incentive Plan, which portion is attributable to |
| These amounts reflect the total grant date fair value computed in accordance with FASB ASC Topic 718 of the portion of the 2022 PSUs pursuant to the Corning |
| (7) |
Compensation Discussion & Analysis
| These amounts reflect the total grant date fair value computed in accordance with FASB ASC Topic 718 of restricted stock units granted in calendar year |
| CORNING 2024 PROXY STATEMENT |
Compensation Discussion & Analysis
Outstanding Equity Awards at 20222023 Fiscal Year-End
The following table shows stock option awards classified as exercisable and unexercisable as of December 31, 2022.2023. The table also shows unvested restricted stock, restricted stock unit and performance stock unit awards assuming a market value of $31.94 per share (the NYSE closing price of the Company’s stock on December 30, 2022)2023).
| Option Awards | Stock Awards | |||||||||||||||||||||||||||
| Named Executive Officer | Grant Date | Vesting Code(1) | Number of Securities Underlying Unexercised Options Exercisable (#) | Number of Securities Underlying Unexercised Options Unexercisable (#) | Option Exercise Price ($) | Option Expiration Date | Number of Shares or Units of Stock that Have Not Vested(2) (#) | Market Value of Shares or Units of Stock That Have Not Vested(3) ($) | Equity Incentive Plan Awards: Number of Unearned Shares, Units or Other Rights That Have Not Vested(4) (#) | Equity Incentive Plan Awards: Market Value or Payout Value of Unearned Shares, Units or Other Rights That Have Not Vested(3) ($) | ||||||||||||||||||
| Wendell P. Weeks | 05/29/15 | A | 47,801 | 0 | 20.92 | 05/29/25 | 779,222 | $ | 24,888,351 | 204,229 | $ | 6,523,074 | ||||||||||||||||
| 05/31/16 | A | 49,366 | 0 | 20.89 | 05/31/26 | |||||||||||||||||||||||
| 03/31/17 | A | 137,514 | 0 | 27.00 | 03/31/27 | |||||||||||||||||||||||
| 04/02/18 | A | 149,849 | 0 | 27.03 | 04/02/28 | |||||||||||||||||||||||
| 04/01/19 | A | 143,721 | 0 | 33.92 | 04/01/29 | |||||||||||||||||||||||
| 05/15/20 | B | 29,017 | 14,508 | 19.65 | 05/15/30 | |||||||||||||||||||||||
| Total | 557,268 | 14,508 | ||||||||||||||||||||||||||
| Edward A. Schlesinger | 04/29/16 | A | 3,013 | 0 | 18.67 | 04/29/26 | 69,974 | 2,234,970 | 28,435 | 908,208 | ||||||||||||||||||
| 05/31/16 | A | 2,693 | 0 | 20.89 | 05/31/26 | |||||||||||||||||||||||
| 03/31/17 | A | 7,501 | 0 | 27.00 | 03/31/27 | |||||||||||||||||||||||
| 04/02/18 | A | 8,741 | 0 | 27.03 | 04/02/28 | |||||||||||||||||||||||
| 04/01/19 | A | 8,844 | 0 | 33.92 | 04/01/29 | |||||||||||||||||||||||
| 05/15/20 | B | 7,189 | 1,736 | 19.65 | 05/15/30 | |||||||||||||||||||||||
| Total | 37,981 | 1,736 | ||||||||||||||||||||||||||
| R. Tony Tripeny | 03/31/14 | A | 6,004 | 0 | 20.82 | 03/31/24 | 97,157 | 3,103,196 | 20,954 | 669,271 | ||||||||||||||||||
| 04/30/14 | A | 5,978 | 0 | 20.91 | 04/30/24 | |||||||||||||||||||||||
| 05/30/14 | A | 5,869 | 0 | 21.30 | 05/30/24 | |||||||||||||||||||||||
| 03/31/15 | A | 5,787 | 0 | 22.68 | 03/31/25 | |||||||||||||||||||||||
| 04/30/15 | A | 6,271 | 0 | 20.93 | 04/30/25 | |||||||||||||||||||||||
| 05/29/15 | A | 6,274 | 0 | 20.92 | 05/29/25 | |||||||||||||||||||||||
| 03/31/16 | A | 8,377 | 0 | 20.89 | 03/31/26 | |||||||||||||||||||||||
| 04/29/16 | A | 9,373 | 0 | 18.67 | 04/29/26 | |||||||||||||||||||||||
| 05/31/16 | A | 8,377 | 0 | 20.89 | 05/31/26 | |||||||||||||||||||||||
| 03/31/17 | A | 31,670 | 0 | 27.00 | 03/31/27 | |||||||||||||||||||||||
| 04/02/18 | A | 35,381 | 0 | 27.03 | 04/02/28 | |||||||||||||||||||||||
| 04/01/19 | A | 34,640 | 0 | 33.92 | 04/01/29 | |||||||||||||||||||||||
| 05/15/20 | B | 10,031 | 0 | 19.65 | 05/15/30 | |||||||||||||||||||||||
| Total | 174,032 | 0 | ||||||||||||||||||||||||||
| Option Awards | Stock Awards | |||||||||||||||||||||||||||
| Named Executive Officer | Grant Date | Vesting Code(1) | Number of Securities Underlying Unexercised Options Exercisable (#) | Number of Securities Underlying Unexercised Options Unexercisable (#) | Option Exercise Price ($) | Option Expiration Date | Number of Shares or Units of Stock That Have Not Vested(2) (#) | Market Value of Shares or Units of Stock That Have Not Vested(3) ($) | Equity Incentive Plan Awards: Number of Unearned Shares, Units or Other Rights That Have Not Vested(4) (#) | Equity Incentive Plan Awards: Market Value or Payout Value of Unearned Shares, Units or Other Rights That Have Not Vested(3) ($) | ||||||||||||||||||
| Wendell P. Weeks | 03/31/17 | A | 137,514 | 0 | 27.00 | 03/31/27 | 455,479 | $ | 13,869,336 | 292,944 | $ | 8,920,145 | ||||||||||||||||
| 04/02/18 | A | 149,849 | 0 | 27.03 | 04/02/28 | |||||||||||||||||||||||
| 04/01/19 | A | 143,721 | 0 | 33.92 | 04/01/29 | |||||||||||||||||||||||
| 05/15/20 | B | 43,525 | 0 | 19.65 | 05/15/30 | |||||||||||||||||||||||
| Total | 474,609 | – | ||||||||||||||||||||||||||
| Edward A. Schlesinger | 04/29/16 | A | 3,013 | 0 | 18.67 | 04/29/26 | 60,593 | 1,845,057 | 56,807 | 1,729,773 | ||||||||||||||||||
| 05/31/16 | A | 2,693 | 0 | 20.89 | 05/31/26 | |||||||||||||||||||||||
| 03/31/17 | A | 7,501 | 0 | 27.00 | 03/31/27 | |||||||||||||||||||||||
| 04/02/18 | A | 8,741 | 0 | 27.03 | 04/02/28 | |||||||||||||||||||||||
| 04/01/19 | A | 8,844 | 0 | 33.92 | 04/01/29 | |||||||||||||||||||||||
| 05/15/20 | B | 8,925 | 0 | 19.65 | 05/15/30 | |||||||||||||||||||||||
| Total | 39,717 | – | ||||||||||||||||||||||||||
| Lawrence D. McRae | 03/31/17 | A | 37,504 | 0 | 27.00 | 03/31/27 | 95,021 | 2,893,389 | 67,646 | 2,059,821 | ||||||||||||||||||
| 04/02/18 | A | 39,960 | 0 | 27.03 | 04/02/28 | |||||||||||||||||||||||
| 04/01/19 | A | 37,588 | 0 | 33.92 | 04/01/29 | |||||||||||||||||||||||
| Total | 115,052 | 0 | ||||||||||||||||||||||||||
| Eric S. Musser | 04/01/19 | A | 34,640 | 0 | 33.92 | 04/01/29 | 168,533 | 5,131,830 | 121,698 | 3,705,704 | ||||||||||||||||||
| 05/15/20 | B | 18,850 | 0 | 19.65 | 05/15/30 | |||||||||||||||||||||||
| Total | 53,490 | 0 | ||||||||||||||||||||||||||
| Lewis A. Steverson | 135,283 | 4,119,367 | 90,768 | 2,763,886 | ||||||||||||||||||||||||
| Total | 0 | 0 | ||||||||||||||||||||||||||
Compensation Discussion & Analysis
| Option Awards | Stock Awards | |||||||||||||||||||||||||||
| Named Executive Officer | Grant Date | Vesting Code(1) | Number of Securities Underlying Unexercised Options Exercisable (#) | Number of Securities Underlying Unexercised Options Unexercisable (#) | Option Exercise Price ($) | Option Expiration Date | Number of Shares or Units of Stock that Have Not Vested(2) (#) | Market Value of Shares or Units of Stock That Have Not Vested(3) ($) | Equity Incentive Plan Awards: Number of Unearned Shares, Units or Other Rights That Have Not Vested(4) (#) | Equity Incentive Plan Awards: Market Value or Payout Value of Unearned Shares, Units or Other Rights That Have Not Vested(3) ($) | ||||||||||||||||||
| Lawrence D. McRae | 03/31/16 | A | 13,463 | 0 | 20.89 | 03/31/26 | 194,159 | 6,201,438 | 42,817 | 1,367,578 | ||||||||||||||||||
| 04/29/16 | A | 15,064 | 0 | 18.67 | 04/29/26 | |||||||||||||||||||||||
| 05/31/16 | A | 13,463 | 0 | 20.89 | 05/31/26 | |||||||||||||||||||||||
| 03/31/17 | A | 37,504 | 0 | 27.00 | 03/31/27 | |||||||||||||||||||||||
| 04/02/18 | A | 39,960 | 0 | 27.03 | 04/02/28 | |||||||||||||||||||||||
| 04/01/19 | A | 37,588 | 0 | 33.92 | 04/01/29 | |||||||||||||||||||||||
| 05/15/20 | B | 12,133 | 6,067 | 19.65 | 05/15/30 | |||||||||||||||||||||||
| Total | 169,175 | 6,067 | ||||||||||||||||||||||||||
| Eric S. Musser | 04/01/19 | A | 34,640 | 0 | 33.92 | 04/01/29 | 242,586 | 7,748,197 | 75,563 | 2,413,485 | ||||||||||||||||||
| 05/15/20 | B | 12,567 | 6,283 | 19.65 | 05/15/30 | |||||||||||||||||||||||
| Total | 47,207 | 6,283 | ||||||||||||||||||||||||||
| Lewis A. Steverson | 05/15/20 | B | 0 | 3,169 | 19.65 | 05/15/30 | 204,405 | 6,528,696 | 61,147 | 1,953,035 | ||||||||||||||||||
| Total | 0 | 3,169 | ||||||||||||||||||||||||||
| (1) | The Company uses the following vesting codes: |
| A: | 100% Vesting 3 years after grant date |
| B: | 1/3 Vesting 1 year after grant date, 1/3 Vesting 2 years after grant date and 1/3 Vesting 3 years after grant date |
| (2) | Amounts include: |
| (i) |
| 76,375; 5,856; |
| (ii) |
| (iii) |
| (iv) |
| (v) |
| (vi) |
| CORNING |
Compensation Discussion & Analysis
| (3) | Year-end market price is based on the December 29, 2023 NYSE closing price of $30.45 |
| (4) | Amounts include: |
| (i) | 62,623; 9,901; 12,871; 23,515, and 18,812 performance stock units granted to Weeks, Schlesinger, McRae, Musser and Steverson, respectively, on April 1, 2022, which vest on April 15, 2025 for which performance results are not yet known. |
| (ii) | 162,876; 30,258; 33,476; 61,159, and 48,927 performance stock units granted to Weeks, Schlesinger, McRae, Musser, and Steverson, respectively, on April 3, 2023, which vest on April 15, 2026. |
| (iii) | 67,445; 16,648; 21,299; 37,024, and 23,029 performance stock units granted to Weeks, Schlesinger, McRae, Musser, and Steverson, respectively, on February 8, 2023, which final vesting date is February 8, 2026. |
Options Exercised and Shares Vested in 20222023
The following table sets forth certain information regarding options exercised and restricted stock, restricted stock units and performance stock units that vested during 20222023 for the NEOs.
| Option Awards | Stock Awards | ||||||||||||
| Named Executive Officer | Number of Shares Acquired on Exercise (#) | Value Realized on Exercise ($) | Number of Shares Acquired on Vesting (#) | Value Realized on Vesting ($) | |||||||||
| Wendell P. Weeks | 174,796 | $ | 3,530,831 | 119,224 | $ | 4,162,306 | |||||||
| Edward A. Schlesinger | 0 | 0 | 18,423 | 618,870 | |||||||||
| R. Tony Tripeny | 0 | 0 | 87,516 | 2,924,548 | |||||||||
| Lawrence D. McRae | 0 | 0 | 33,432 | 1,167,711 | |||||||||
| Eric S. Musser | 0 | 0 | 33,466 | 1,174,682 | |||||||||
| Lewis A. Steverson | 29,334 | 144,140 | 26,176 | 919,447 | |||||||||
| Option Awards | Stock Awards | |||||||||||
| Named Executive Officer | Number of Shares Acquired on Exercise (#) | Value Realized on Exercise ($) | Number of Shares Acquired on Vesting (#) | Value Realized on Vesting ($) | ||||||||
| Wendell P. Weeks | 97,167 | $1,419,109 | 525,954 | $ | 18,147,521 | |||||||
| Edward A. Schlesinger | 0 | 0 | 42,716 | 1,460,356 | ||||||||
| Lawrence D. McRae | 60,190 | 787,926 | 139,824 | 4,816,123 | ||||||||
| Eric S. Musser | 0 | 0 | 151,488 | 5,219,134 | ||||||||
| Lewis A. Steverson | 3,169 | 46,239 | 129,392 | 4,462,018 | ||||||||
Retirement Plans
Qualified Pension Plan
Corning maintains a qualified defined benefit pension plan to provide retirement income to Corning’s U.S.-based employees which was amended effective July 1, 2000, to include a cash balance component. All salaried and non-union hourly employees as of July 1, 2000, were given a choice to prospectively accrue benefits under the previously existing career average earnings formula or a cash balance formula, if so elected. Employees hired subsequent to July 1, 2000, earn benefits solely under the cash balance formula.
Benefits earned under the career average earnings formula are equal to 1.5% of plan compensation plus 0.5% of plan compensation on which employee contributions have been made. Under the career average earnings formula, participants may retire as early as age 55 with 5 years of service. Unreduced benefits are available when a participant attains the earlier of age 60 with 5 years of service or age 55 with 30 years of service. Otherwise, benefits are reduced 4% for each year by which retirement precedes the attainment of age 60. Pension benefits earned under the career average earnings formula are distributed in the form of a lifetime annuity with six years of payments guaranteed.
Benefits earned under the cash balance formula are expressed in the form ofas a hypothetical account balance. Each month a participant’s cash balance account is increased by (1) pay credits based on the participant’s plan compensation for that month and (2) interest credits based on the participant’s hypothetical account balance at the end of the prior month. Pay credits vary between 3% and 8% based on the participant’s age plus service at the end of the year. Interest credits are based on 10-year Treasury bond yields, subject to a minimum credit of 3.80%. Pension benefits under the cash balance formula may be distributed as either a lump sum of the participant’s hypothetical account balance or an actuarial equivalent life annuity.
Messrs. Weeks McRae and Musser are earning benefits under the career average earnings formula. Messrs. Schlesinger Tripeny and Steverson are earning benefits under the cash balance formula. All of the active and currently-employed NEOs except Mr. Steverson are currently eligible to retire under the plan. Mr. McRae retired at the end of 2023 with benefits earned under the career average earnings formula.
| CORNING 2024 PROXY STATEMENT | 83 |
Compensation Discussion & Analysis
Supplemental Pension Plan and Executive Supplemental Pension Plan
Since 1986, Corning has maintained non-qualified pension plans to attract and retain its executive workforce by providing eligible employees with retirement benefits in excess of those permitted under the qualified plans. The benefits provided under the Supplemental Pension Plan (SPP) are equal to the difference between the benefits provided under the Corning Incorporated Pension Plan and benefits that would have been provided thereunder if not for the limitations of the Employee Retirement Income Security Act of 1974, as amended, and the Internal Revenue Code of 1986, as amended (the Code).
Compensation Discussion & Analysis
Each NEO participates in the Corning Incorporated Executive Supplemental Pension Plan (ESPP). Participants in the ESPP receive no benefits from the SPP, other than earned SPP benefits under the cash balance formula prior to their participation in the ESPP, if any (the value of which is subtracted from the final ESPP annuity benefit). Executives fully vest in their ESPP benefit upon attainment of age 50 with 10 years of service. All NEOs except Mr. Steverson are fully vested in the ESPP.
Under the ESPP, participants earn benefits based on the highest 60 consecutive months of average plan compensation over the last 120 months immediately preceding the date of termination of employment.
A change in the benefits provided under the ESPP formula was approved in December 2006. Following the change, gross Gross benefits for all NEOs as determined under this plan are equal to 2.0% of average plan compensation multiplied by years of service up to 25 years (the “ESPP Formula”).
Benefits earned under the Corning Incorporated Pension Plan and the cash balance formula of the SPP prior to ESPP participation, if any, will offset benefits earned under the ESPP.
Participants may retire as early as age 55 with 10 years of service. Unreduced benefits under the ESPP Formula are available when a participant attains the earlier of age 60 with 10 years of service or age 55 with 25 years of service. Participants with accrued benefits in excess of four times the annual compensation limitation under Section 401(a)(17) of the Code must be age 57 with 25 years of service to receive an unreduced benefit under the ESPP. Otherwise, benefits are reduced 4% for each year by which retirement precedes the attainment of age 60. Benefit reductions of 1% per year by which retirement precedes age 57 apply if the four-times-annual-compensation-limit rule noted above is in effect for the participant.
Benefits earned under the ESPP are distributed in the form of a lifetime annuity, with six years of payments guaranteed except for benefits earned under the cash balance formula of the SPP prior to becoming a participant in the ESPP, which is distributed as a lump sum of the participant’s credited balance.sum.
All NEOs except Mr. Steverson are currently eligible to retire under the ESPP.
Pension Benefits
The table below shows the actuarial present value of accumulated benefits payable to each of the NEOs, including the number of years of service credited to each such NEO, under the qualified pension plan and the ESPP. These amounts were determined using interest rate and mortality rate assumptions consistent with those used in the Company’s financial statements with the exception ofexcept for the assumed retirement age and the assumed probabilities of leaving employment prior to retirement. Retirement was assumed to occur at the earliest possible unreduced retirement age for each plan in which the executive participates. For purposes of determining the earliest unreduced retirement age, service was assumed to be granted until the actual date of retirement. For example, an executive under the ESPP formula who is age 50 with 20 years of service would be assumed to retire at age 55 due to eligibility of unreduced benefits at age 55 with 25 years of service. No termination, disability or death was assumed to occur prior to retirement. Otherwise, the assumptions used are described in Note 1211 to our Financial Statements for the year ended December 31, 2022,2023, of our Annual Report on Form 10-K filed with the SEC on February 13, 2023.12, 2024.
| CORNING |
Compensation Discussion & Analysis
| Named Executive Officer | Plan Name | Number of Years Credited Service (#) | Present Value of Accumulated Benefit ($) | Payments During Last Fiscal Year ($) | |||||||
| Wendell P. Weeks | Qualified Pension Plan | 40 | $ | 1,851,564 | $ | 0 | |||||
| ESPP | 25 | (1) | 24,191,775 | 0 | |||||||
| Edward A. Schlesinger | Qualified Pension Plan | 10 | 145,630 | 0 | |||||||
| ESPP | 10 | 1,376,849 | 0 | ||||||||
| R. Tony Tripeny | Qualified Pension Plan | 37 | 0 | 499,390 | |||||||
| ESPP | 25 | (1) | 8,465,105 | 460,012 | |||||||
| Lawrence D. McRae | Qualified Pension Plan | 37 | 1,592,078 | 0 | |||||||
| ESPP | 25 | (1) | 8,679,758 | 0 | |||||||
| Eric S. Musser | Qualified Pension Plan | 37 | 1,445,301 | 0 | |||||||
| ESPP | 25 | (1) | 9,067,543 | 0 | |||||||
| Lewis A. Steverson | Qualified Pension Plan | 10 | 166,438 | 0 | |||||||
| ESPP | 10 | 3,324,151 | 0 | ||||||||
| Named Executive Officer | Plan Name | Number of Years Credited Service (#) | Present Value of Accumulated Benefit ($) | Payments During Last Fiscal Year ($) | |||||||
| Wendell P. Weeks | Qualified Pension Plan | 41 | $ 1,997,943 | $ 0 | |||||||
| ESPP | 25 | (1) | 24,375,091 | 0 | |||||||
| Edward A. Schlesinger | Qualified Pension Plan | 11 | 180,798 | 0 | |||||||
| ESPP | 11 | 1,850,796 | 0 | ||||||||
| Lawrence D. McRae | Qualified Pension Plan | 38 | 1,680,590 | 0 | |||||||
| ESPP | 25 | (1) | 8,700,842 | 0 | |||||||
| Eric S. Musser | Qualified Pension Plan | 38 | 1,535,923 | 0 | |||||||
| ESPP | 25 | (1) | 9,226,022 | 0 | |||||||
| Lewis A. Steverson | Qualified Pension Plan | 11 | 203,781 | 0 | |||||||
| ESPP | 11 | 3,989,580 | 0 | ||||||||
| (1) | Under Formula A, years of service are capped at 25 years, in determining benefits under the ESPP. |
The compensation considered for purposes of determining benefits under the qualified pension plan and the ESPP for the NEOs is the “Salary” plus the GoalSharing and PIP cash bonuses set forth in the Summary Compensation Table. Bonuses are included as compensation in the calendar year paid. Long-term cash or equity incentives are not (and have never been) considered as eligible earnings for determining retirement benefits under these plans. For the 20222023 calendar year, the NEOs’ eligible earnings and final average compensation were as follows:
| As of December 31, 2022 | |||||||
| Named Executive Officer | Eligible Pension Earnings | Final Average Earnings | |||||
| Wendell P. Weeks | $ | 5,453,659 | $ | 4,163,490 | |||
| Edward A. Schlesinger | 1,053,933 | 751,181 | |||||
| R. Tony Tripeny | 1,605,828 | 1,430,782 | |||||
| Lawrence D. McRae | 2,125,085 | 1,677,331 | |||||
| Eric S. Musser | 2,762,483 | 1,688,750 | |||||
| Lewis A. Steverson | 2,055,812 | 1,451,173 | |||||
| As of December 31, 2023 | |||||||
| Named Executive Officer | Eligible Pension Earnings | Final Average Earnings | |||||
| Wendell P. Weeks | $ | 3,150,520 | $ | 4,163,490 | |||
| Edward A. Schlesinger | 1,011,725 | 820,200 | |||||
| Lawrence D. McRae | 1,398,015 | 1,677,550 | |||||
| Eric S. Musser | 1,678,780 | 1,707,978 | |||||
| Lewis A. Steverson | 1,405,683 | 1,457,593 | |||||
Non-qualified Deferred Compensation
The table below shows the contributions, earnings and account balances for the NEOs in the Supplemental Investment Plan. Pursuant to the Company’s Supplemental Investment Plan, the NEOs may choose to defer up to 75% of annual base salary and up to 75% of GoalSharing and PIP cash bonuses. The participant chooses from the same funds available under our Company Investment Plan (401(k)) in which to “invest” the deferred amounts. No cash is actually invested in the unfunded accounts under the Supplemental Investment Plan. Deferred amounts incur gains and losses based on the performance of the individual participant’s investment fund selections. Participants may change their elections among these fund options. Corning does not have any above marketabove-market earnings under its Supplemental Investment Plan. All of our current NEOs have more than three years of service with the Company, so all of the Company’s matching contributions are fully vested. Participants cannot withdraw any amounts from their deferred compensation balances until retirement from the Company at or after age 55 with 5 years of service. Participants may elect to receive distributions as a lump sum payment or two to five annual installments. If an NEO leaves the Company prior to retirement, the account balance is distributed in a lump sum six months following the executive’s departure.
Following his retirement, Mr. Tripeny received a lump sum distribution in November 2022 in accordance with his distribution election.
| CORNING |
Compensation Discussion & Analysis
| Named Executive Officer | Aggregate Balance at January 1, 2022 ($) | Executive Contributions in 2022 ($)(1) | Company Contributions in 2022 ($)(2) | Aggregate Earnings in 2022 ($)(3) | Aggregate Withdrawals/ Distributions in 2022 ($) | Aggregate Balance as of December 31, 2022 ($) | |||||||||||||
| Wendell P. Weeks | $ | 9,567,478 | $ | 82,385 | $ | 84,788 | $ | -1,445,716 | $ | 0 | $ | 8,288,935 | |||||||
| Edward A. Schlesinger | 294,507 | 67,404 | 30,402 | -46,223 | 0 | 346,090 | |||||||||||||
| R. Tony Tripeny | 5,337,501 | 262,704 | 52,541 | -846,501 | -4,806,245 | 0 | |||||||||||||
| Lawrence D. McRae | 171,645 | 390,633 | 124,555 | -60,022 | 0 | 626,811 | |||||||||||||
| Eric S. Musser | 0 | 0 | 0 | 0 | 0 | 0 | |||||||||||||
| Lewis A Steverson | 1,008,487 | 384,162 | 76,833 | -189,548 | 0 | 1,279,934 | |||||||||||||
| Named Executive Officer | Aggregate Balance at January 1, 2023 ($) | Executive Contributions in 2023 ($)(1) | Company Contributions in 2023 ($)(2) | Aggregate Earnings in 2023 ($)(3) | Aggregate Withdrawals/ Distributions in 2023 ($) | Aggregate Balance as of December 31, 2023 ($) | |||||||||||||
| Wendell P. Weeks | $8,288,935 | $ 65,631 | $67,545 | $1,098,624 | $0 | $9,520,735 | |||||||||||||
| Edward A. Schlesinger | 346,090 | 54,043 | 24,019 | 81,422 | 0 | 505,574 | |||||||||||||
| Lawrence D. McRae | 626,811 | 203,228 | 77,558 | 120,464 | 0 | 1,028,060 | |||||||||||||
| Eric S. Musser | 0 | 0 | 0 | 0 | 0 | 0 | |||||||||||||
| Lewis A. Steverson | 1,279,934 | 110,777 | 22,155 | 224,040 | 0 | 1,636,906 | |||||||||||||
| (1) | Reflects participation in the Supplemental Investment Plan by |
| (2) | Reflects Company match on the Supplemental Investment Plan, which was credited to the account of the Named Executive Officers in |
| (3) | Reflects aggregate earnings on each type of deferred compensation listed above. The earnings on deferred base salary and bonus payments are calculated based on the actual returns from the same fund choices that Company employees have in the qualified 401(k) plan. Currently, employees have 16 fund choices that they may select from. As nonqualified plans, these plans are unfunded, which means that no actual dollars are invested in these funds. The Company does not provide any above-market interest rates or other special terms for any deferred amounts. These amounts are not included in the Change in Pension Value and Nonqualified Deferred Compensation Earnings column of the Summary Compensation Table. |
Arrangements with Named Executive Officers
Severance Agreements
We have entered into severance agreements with each of our NEOs. All new executive severance agreements and executive change-in-control agreements entered intoexecuted after July 2004, limit the benefits that may be provided to an executive to 2.99 times the executive’s annual compensation of base salary plus target incentive payments. Messrs.Mr. Weeks and McRae have agreements which werehas an agreement in effect prior tobefore July 2004. Messrs. Musser, Schlesinger and Steverson all have the new form of agreement. Mr. McRae retired voluntarily on December 31, 2023.
Severance Agreements—Agreements — Mr. Weeks
Under Mr. Weeks’ severance agreement, if he is terminated involuntarily, and without cause, or as a result of disability, he is entitled to the following:
| • | Base salary, reimbursable expenses and annual bonus accrued and owing as of the date of termination (lump sum payment); |
| • | A severance amount equal to 2.99 times the sum of his then-base salary plus his annual target bonus amount |
| • | Continued participation in the Company’s benefit plans for up to three years; and |
| • | In the calendar year following the year in which the termination occurs (subject to a six-month waiting period), the purchase of his principal residence by the Company upon request. |
If however, Mr. Weeks is terminated for cause or he resigns, he would (1) be entitled to accrued, but unpaid salary (lump sum payment) and any reimbursable expenses accrued or owing to him and, if terminated for cause, (2)he would forfeit any outstanding stock awards.
| CORNING |
Compensation Discussion & Analysis
Severance Agreements—Other Named Executive Officers
Under the severance agreements, an NEO is entitled to severance payments if he is terminated involuntarily other than for cause.
Generally, under the severance agreements, an NEO (other than Mr. Weeks) is entitled to receive the following:
| • | Accrued but unpaid base salary, reimbursable expenses, |
| • |
| • | Continued medical, dental and hospitalization benefits for 24 months; |
| • | In the calendar year following the year in which the termination occurs (subject to a six-month waiting period), the purchase of his principal residence by the Company upon request; and |
| • | Outplacement benefits up to a maximum amount of $50,000. |
The following table reflects the amounts that would be payable under the various arrangements assuming termination occurred at December 31, 2022.2023.
| TERMINATION SCENARIOS (INCLUDING SEVERANCE, IF ELIGIBLE) | |||||||||||||
| Named Executive Officer | Voluntary(1) | For Cause | Death(2) | Disability(1) | Without Cause | ||||||||
| Wendell P. Weeks | Severance Amount | n/a | n/a | n/a | n/a | $12,046,710 | |||||||
| Value of Benefits Continuation | n/a | n/a | n/a | n/a | 60,168 | (3) | |||||||
| Value of Outplacement Services | n/a | n/a | n/a | n/a | n/a | ||||||||
| Purchase of Principal Residence | n/a | n/a | n/a | n/a | 250,000 to 1,000,000 | (4) | |||||||
| Pension - Non-Qualified Annuity | $1,933,618 | $0 | $1,933,618 | $1,933,618 | 1,933,618 | ||||||||
| Pension - Non-Qualified Lump Sum | n/a | n/a | n/a | n/a | n/a | ||||||||
| Pension - Qualified Annuity | 148,127 | 148,127 | 74,063 | 148,127 | 148,127 | ||||||||
| Edward A. Schlesinger | Severance Amount | n/a | n/a | n/a | n/a | 2,275,000 | |||||||
| Value of Benefits Continuation | n/a | n/a | n/a | n/a | 60,750 | (3) | |||||||
| Value of Outplacement Services | n/a | n/a | n/a | n/a | 50,000 | ||||||||
| Purchase of Principal Residence | n/a | n/a | n/a | n/a | 50,000 to 250,000 | (4) | |||||||
| Pension - Non-Qualified Annuity | 134,986 | 0 | 104,966 | 134,986 | 134,986 | ||||||||
| Pension - Non-Qualified Lump Sum | n/a | n/a | n/a | n/a | n/a | ||||||||
| Pension - Qualified Lump Sum | 169,059 | 169,059 | 84,529 | 169,059 | 169,059 | ||||||||
| R. Tony Tripeny(5) | Severance Amount | n/a | n/a | n/a | n/a | n/a | |||||||
| Value of Benefits Continuation | n/a | n/a | n/a | n/a | n/a | ||||||||
| Value of Outplacement Services | n/a | n/a | n/a | n/a | n/a | ||||||||
| Purchase of Principal Residence | n/a | n/a | n/a | n/a | n/a | ||||||||
| Pension - Non-Qualified Annuity | 570,838 | n/a | n/a | n/a | n/a | ||||||||
| Pension - Non-Qualified Lump Sum | n/a | n/a | n/a | n/a | n/a | ||||||||
| Pension - Qualified Lump Sum | n/a | n/a | n/a | n/a | n/a | ||||||||
| Lawrence D. McRae | Severance Amount | n/a | n/a | n/a | n/a | 3,345,900 | |||||||
| Value of Benefits Continuation | n/a | n/a | n/a | n/a | 60,750 | (3) | |||||||
| Value of Outplacement Services | n/a | n/a | n/a | n/a | 50,000 | ||||||||
| Purchase of Principal Residence | n/a | n/a | n/a | n/a | 50,000 to 250,000 | (4) | |||||||
| Pension - Non-Qualified Annuity | 708,581 | 0 | 550,622 | 708,581 | 708,581 | ||||||||
| Pension - Non-Qualified Lump Sum | n/a | n/a | n/a | n/a | n/a | ||||||||
| Pension - Qualified Annuity | 130,085 | 130,085 | 65,042 | 130,085 | 130,085 | ||||||||
| TERMINATION SCENARIOS (INCLUDING SEVERANCE, IF ELIGIBLE) | |||||||||||||
| Named Executive Officer | Voluntary(1) | For Cause | Death(2) | Disability(1) | Without Cause | ||||||||
| Wendell P. Weeks | Severance Amount | n/a | n/a | n/a | n/a | $12,046,710 | |||||||
| Value of Benefits Continuation | n/a | n/a | n/a | n/a | 61,452 | (3) | |||||||
| Value of Outplacement Services | n/a | n/a | n/a | n/a | n/a | ||||||||
| Purchase of Principal Residence | n/a | n/a | n/a | n/a | 250,000 to 1,000,000 | (4) | |||||||
| Pension - Non-Qualified Annuity | $1,923,907 | $0 | $1,923,907 | $1,923,907 | 1,923,907 | ||||||||
| Pension - Non-Qualified Lump Sum | n/a | n/a | n/a | n/a | n/a | ||||||||
| Pension - Qualified Annuity | 157,838 | 157,838 | 78,919 | 157,838 | 157,838 | ||||||||
| Edward A. Schlesinger | Severance Amount | n/a | n/a | n/a | n/a | 2,275,000 | |||||||
| Value of Benefits Continuation | n/a | n/a | n/a | n/a | 62,034 | (3) | |||||||
| Value of Outplacement Services | n/a | n/a | n/a | n/a | 50,000 | ||||||||
| Purchase of Principal Residence | n/a | n/a | n/a | n/a | 50,000 to 250,000 | (4) | |||||||
| Pension - Non-Qualified Annuity | 138,203 | 0 | 118,563 | 163,942 | 138,203 | ||||||||
| Pension - Non-Qualified Lump Sum | n/a | n/a | n/a | n/a | n/a | ||||||||
| Pension - Qualified Lump Sum | 195,870 | 195,870 | 195,870 | 195,870 | 195,870 | ||||||||
| Lawrence D. McRae(5) | Severance Amount | n/a | n/a | n/a | n/a | n/a | |||||||
| Value of Benefits Continuation | n/a | n/a | n/a | n/a | n/a | ||||||||
| Value of Outplacement Services | n/a | n/a | n/a | n/a | n/a | ||||||||
| Purchase of Principal Residence | n/a | n/a | n/a | n/a | n/a | ||||||||
| Pension - Non-Qualified Annuity | 530,107 | n/a | n/a | n/a | n/a | ||||||||
| Pension - Non-Qualified Lump Sum | n/a | n/a | n/a | n/a | n/a | ||||||||
| Pension - Qualified Annuity | 135,884 | n/a | n/a | n/a | n/a | ||||||||
| Eric S. Musser | Severance Amount | n/a | n/a | n/a | n/a | 3,717,200 | |||||||
| Value of Benefits Continuation | n/a | n/a | n/a | n/a | 40,968 | (3) | |||||||
| Value of Outplacement Services | n/a | n/a | n/a | n/a | 50,000 | ||||||||
| Purchase of Principal Residence | n/a | n/a | n/a | n/a | 50,000 to 250,000 | (4) | |||||||
| Pension - Non-Qualified Annuity | 732,016 | 0 | 541,936 | 732,016 | 732,016 | ||||||||
| Pension - Non-Qualified Lump Sum | n/a | n/a | n/a | n/a | n/a | ||||||||
| Pension - Qualified Annuity | 121,973 | 121,973 | 60,987 | 121,973 | 121,973 | ||||||||
| CORNING |
Compensation Discussion & Analysis
| Named Executive Officer | Voluntary(1) | For Cause | Death(2) | Disability(1) | Without Cause | Voluntary(1) | For Cause | Death(2) | Disability(1) | Without Cause | ||||||||||||||||
| Eric S. Musser | Severance Amount | n/a | n/a | n/a | n/a | 3,717,200 | ||||||||||||||||||||
| Value of Benefits Continuation | n/a | n/a | n/a | n/a | 40,112 | (3) | ||||||||||||||||||||
| Value of Outplacement Services | n/a | n/a | n/a | n/a | 50,000 | |||||||||||||||||||||
| Purchase of Principal Residence | n/a | n/a | n/a | n/a | 50,000 to 250,000 | (4) | ||||||||||||||||||||
| Pension - Non-Qualified Annuity | 728,201 | 0 | 539,391 | 728,201 | 728,201 | |||||||||||||||||||||
| Pension - Non-Qualified Lump Sum | n/a | n/a | n/a | n/a | n/a | |||||||||||||||||||||
| Pension - Qualified Annuity | 116,174 | 116,174 | 58,087 | 116,174 | 116,174 | |||||||||||||||||||||
| Lewis A. Steverson | Severance Amount | n/a | n/a | n/a | n/a | 2,981,300 | Severance Amount | n/a | n/a | n/a | n/a | 2,981,300 | ||||||||||||||
| Value of Benefits Continuation | n/a | n/a | n/a | n/a | 40,288 | (3) | Value of Benefits Continuation | n/a | n/a | n/a | n/a | 62,034 | (3) | |||||||||||||
| Value of Outplacement Services | n/a | n/a | n/a | n/a | 50,000 | Value of Outplacement Services | n/a | n/a | n/a | n/a | 50,000 | |||||||||||||||
| Purchase of Principal Residence | n/a | n/a | n/a | n/a | 50,000 to 250,000 | (4) | Purchase of Principal Residence | n/a | n/a | n/a | n/a | 50,000 to 250,000 | (4) | |||||||||||||
| Pension - Non-Qualified Annuity | n/a | n/a | n/a | 261,658 | n/a | Pension - Non-Qualified Annuity | 290,693 | 0 | n/a | 290,693 | 290,693 | |||||||||||||||
| Pension - Non-Qualified Lump Sum | 527,843 | 0 | 527,843 | n/a | 527,843 | Pension - Non-Qualified Lump Sum | n/a | n/a | n/a | n/a | n/a | |||||||||||||||
| Pension - Qualified Lump Sum | 182,981 | 182,981 | 182,981 | 182,981 | 182,981 | Pension - Qualified Lump Sum | 213,701 | 213,701 | 213,701 | 213,701 | 213,701 | |||||||||||||||
| (1) | Non-qualified plan benefits shown for all NEOs |
| (2) | Non-qualified annuity payments in the event of death for |
| (3) | The value of welfare benefits continuation is estimated at |
| (4) | Under the terms of the severance agreements, the NEOs may also request that Corning purchase their principal residence in the Corning, New York area. Corning is unable to accurately and precisely estimate the value that may be delivered under this provision as it requires an independent appraisal of the executive’s residence, as well as, for |
| (5) |
Change-in-Control Agreements
We have entered into change-in-control agreements with each of the NEOs. These agreements are intended to provide for continuity of management if there is a change in control of the Company. These agreements will be effective until the executive leaves the employ of Corning or until the executive ceases to be an officer of Corning.
If during the term of the agreement a change in control occurs, the restrictions on all restricted stock and restricted stock units held by the NEO lapse, and any stock options vest and become immediately exercisable. Cash performance units and performance stock units are adjusted based on actual performance for completed performance periods and assumed performance of 100% for incomplete performance and adjusted CPUs and PSUs are vested and released immediately.
The NEOs are also entitled to severance and other benefits upon certain terminations of employment following or in connection with a change in control.
| • | For Mr. Weeks, benefits are payable if he (i) is terminated without cause or resigns for “good reason,” each during a “potential change in control period” or (ii) resigns or is terminated for any reason or within four years following a change in control. |
| • | For the NEOs (other than Mr. Weeks), benefits are payable if their employment is terminated (other than for cause, by reason of death or disability, or by the executive for any reason) during a potential change in control period, or within two years following a change in control. |
Compensation Discussion & Analysis
The benefits payable are as follows:
| • | Accrued but unpaid base salary, reimbursable expenses, |
| • | A severance amount equal to 2.99 times (for Mr. Weeks) |
| • | Continued participation in the Company’s benefit plans for 3 years; |
| • | Upon request, purchase of the NEO’s principal residence in the Corning, NY area; and |
| • | Outplacement benefits (equal to 20% of base salary) (excluding Mr. Weeks). |
| 88 | CORNING 2024 PROXY STATEMENT |
Compensation Discussion & Analysis
If the employment of an NEO (other than Mr. Weeks) is terminated for cause or he resigns for other than good reason, or the NEO’s employment terminates by reason of death or disability, the NEO is entitled to accrued but unpaid base salary, reimbursable expenses, vacation pay and the executive’s target percentage for the annual bonus, plans multiplied by the executive’s salary, pro-rated to the last day of the month closest to the termination date (lump sum payment). In addition, Messrs. Weeks and McRae areis generally entitled to receive a gross-up payment in an amount sufficient to make him whole for any federal excise tax on excess parachute payments imposed under Section 280G and 4999 of the Internal Revenue Code. However, if the federal excise tax can be avoided by reducing the related payments by a present value of $45,000 or less, then the payment will be reduced to the extent necessary to avoid the excise tax and no gross-up payment will be made to the NEO.other NEOs.
The following table reflects the amounts that would be payable under the various arrangements assuming that a change in control occurred on December 31, 2022.2023.
| Cash-based | Long-Term Incentives(1) | Cash-based | Long-Term Incentives(1) | |||||||||||||||||||||||||||||||||||||||||||||||
| Named Executive Officer | Cash Severance | Interrupted Perf. Cycles | ESPP ($) | Misc. Benefits ($) | Excise Tax Gross Up ($) | Interrupted CPU Perf. Cycles ($) | Share-based Awards ($) | Total Benefits ($) | Cash | Interrupted | ESPP ($) | Misc. | Excise | Interrupted | Share-based | Total | ||||||||||||||||||||||||||||||||||
| Wendell P. Weeks | $ | 16,441,746 | $ | 0 | $ | 26,183,918 | $ | 110,167 | $ | 0 | $ | 5,770,375 | $ | 26,181,609 | $ | 74,687,815 | $ | 12,087,051 | $0 | $ | 24,410,235 | $ | 111,452 | $0 | $ | 4,859,708 | $ | 24,078,429 | $ | 65,546,875 | ||||||||||||||||||||
| Edward A. Schlesinger | 1,169,547 | 0 | 1,612,541 | 110,750 | 0 | 658,000 | 2,457,572 | 6,008,410 | 859,319 | 0 | 1,954,509 | 112,035 | 0 | 843,000 | 3,230,836 | 6,999,699 | ||||||||||||||||||||||||||||||||||
| R. Tony Tripeny | n/a | n/a | n/a | n/a | n/a | n/a | n/a | n/a | ||||||||||||||||||||||||||||||||||||||||||
| Lawrence D. McRae | 3,345,900 | 0 | 9,371,246 | 110,750 | 0 | 1,241,500 | 6,611,538 | 20,680,934 | ||||||||||||||||||||||||||||||||||||||||||
| Lawrence D. McRae(2) | n/a | n/a | n/a | n/a | n/a | n/a | n/a | n/a | ||||||||||||||||||||||||||||||||||||||||||
| Eric S. Musser | 3,717,200 | 0 | 9,808,309 | 90,111 | 0 | 2,092,625 | 8,439,359 | 24,147,604 | 3,717,200 | 0 | 9,238,142 | 90,968 | 0 | 1,824,792 | 8,821,944 | 23,693,046 | ||||||||||||||||||||||||||||||||||
| Lewis A. Steverson | 2,709,501 | 0 | 3,697,068 | 90,288 | 0 | 1,720,000 | 7,508,723 | 15,725,580 | 2,981,300 | 0 | 4,014,587 | 112,035 | 0 | 1,459,833 | 7,024,480 | 15,592,235 | ||||||||||||||||||||||||||||||||||
| (1) | Long-term |
| (2) | McRae would not be eligible for change in control benefits due to his retirement on December 31, 2023. |
In addition to the above, the NEOs may also request that Corning purchase their principal residence. Corning is unable to accurately and precisely estimate the value as it requires an independent appraisal of the executive’s residence and, for all, a calculation of the executive’s purchase price of such residence and any documented improvements made to the property. This is data that Corning does not maintain in its normal course of business. See footnote (3)(4) to the “Termination Scenarios” on page 90.87.
| CORNING |


Pay Ratio Disclosure
For 2022,2023, the annual total compensation of the median employee, excluding our CEO, was $36,485$42,240 and the annual total compensation of our CEO was $16,169,469.$15,627,653. Accordingly, the ratio of the CEO’s annual total compensation to the annual total compensation of the median employee was 443:370:1.
This reflects analysis of our global workforce of employees as of October 1, 2022,2023, which excludes 7081 employee in Argentina, 307 employees in Brazil, 396130 employees in Hungary, 406 employees in India, 1473 employees in South Africa,Pakistan, 13 employees in the Philippines, 9 employees in the Russian Federation, and 282269 employees in Turkey which are de minimis relative to the size of our global workforce. We used estimated total cash compensation to determine the median employee. Our estimate of total cash compensation for our full 20222023 fiscal year included (i) annual base salary plus annual incentives calculated at target for salaried employees and (ii) hourly salary rate times annual standard hours plus additional adjustments for shift differentials, estimated overtime rates, production bonuses, holiday bonuses, fixed bonuses and other cash allowances paid to hourly employees.
Our estimates were based on an analysis of the pay components and payrolls in each of the 4036 countries in which we operate, excluding Argentina, Brazil, Hungary, India, South AfricaPakistan, Philippines, Russian Federation and Turkey. Total cash compensation rates of employees paid in foreign currencies were converted into U.S. dollars using our standard monthly foreign exchange conversion rates in effect on October 1, 20222023 for the determination of the median and December 31, 20222023 for the year-end actual total compensation. Once the median employee was identified, actual total compensation was determined in accordance with Item 402(c)(2)(x) of Regulation S-K.
The SEC’s rules for identifying the median compensated employee and calculating the pay ratio based on that employee’s annual total compensation allow companies to adopt a variety of methodologies, to apply certain exclusions, and to make reasonable estimates and assumptions that reflect their employee populations and compensation practices. As a result, the pay ratio reported by other companies may not be comparable to the pay ratio reported above, as other companies have different employee populations and compensation practices and may utilize different methodologies, exclusions, estimates and assumptions in calculating their own pay ratios.
| CORNING |
Other Information
Pay Versus Performance Table and Disclosures | |||||||||||||||||||||
As required by Section 953(a) of the Dodd-Frank Wall Street Reform and Consumer Protection Act, and Item 402(v) of Regulation S-K, we are providing the following information about the relationship between executive compensation actually paid (as defined by SEC rules) and certain financial performance of the Company. The Compensation and Talent Management Committee (the Committee) did not consider the pay versus performance disclosure when making its incentive compensation decisions. For further information about how we align executive compensation with the Company’s performance, see “Compensation Discussion and Analysis” starting on page 57. The following table sets forth the required compensation information for our NEOs, calculated in accordance with SEC regulations, for fiscal years 2023, 2022, 2021 and 2020.
| |||||||||||||||||||||
| Year(1) | Summary Compensation Table Total for CEO(2) | Compensation Actually Paid to CEO(2) | Average Summary Compensation Table Total for Non-CEO NEOs(2) | Average Compensation Actually Paid to Non-CEO NEOs(2) | Value of Initial Fixed $100 Investment Based On: | Corning GAAP Net Income ($mm) | Corning Core Net Sales ($mm) | ||||||||||||||
| Corning Total Shareholder Return | S&P 500 Communications Equipment Total Shareholder Return(3) | ||||||||||||||||||||
| (a) | (b) | (c) | (d) | (e) | (f) | (g) | (h) | (i) | |||||||||||||
| 2023 | $15,627,653 | $12,798,655 | $5,062,725 | $3,993,516 | $118.03 | $150.85 | $ 581 | $13,580 | |||||||||||||
| 2022 | 16,169,469 | 8,744,301 | 4,271,097 | 2,645,033 | 119.50 | 123.73 | 1,316 | 14,805 | |||||||||||||
| 2021 | 20,766,032 | 27,146,225 | 6,421,907 | 7,930,517 | 135.13 | 154.17 | 1,906 | 14,120 | |||||||||||||
| 2020 | 18,951,753 | 26,306,100 | 5,573,311 | 7,431,466 | 127.57 | 101.28 | 512 | 11,452 | |||||||||||||
Pay Versus Performance Table and Disclosures
As required by Section 953(a) of the Dodd-Frank Wall Street Reform and Consumer Protection Act, and Item 402(v) of Regulation S-K, we are providing the following information about the relationship between executive compensation actually paid (as defined by SEC rules) and certain financial performance of the Company. The Compensation and Talent Management Committee (the Committee) did not consider the pay versus performance disclosure when making its incentive compensation decisions. For further information about how we align executive compensation with the Company’s performance, see “Compensation Discussion and Analysis” starting on page 58. The following table sets forth the required compensation information for our NEOs, calculated in accordance with SEC regulations, for fiscal years 2022, 2021 and 2020.
| Year | Summary Compensation Table Total for CEO | Compensation Actually Paid to CEO | Average Summary Compensation Table Total for Non-CEO NEOs | Average Compensation Actually Paid to Non-CEO NEOs | Value of Initial Fixed $100 Investment Based On: | Corning GAAP Net Income ($mm) | Corning Core Net Sales ($mm) | ||||||||||||||
| Corning Total Shareholder Return | S&P 500 Communications Equipment Total Shareholder Return | ||||||||||||||||||||
| (a) | (b) | (c) | (d) | (e) | (f) | (g) | (h) | (i) | |||||||||||||
| 2022 | $16,169,469 | $ | 8,786,398 | $4,271,097 | $2,657,079 | $119.50 | $123.73 | $1,316 | $14,805 | ||||||||||||
| 2021 | 20,766,032 | 27,146,225 | 6,421,907 | 7,930,517 | 135.13 | 154.17 | 1,906 | 14,120 | |||||||||||||
| 2020 | 18,951,753 | 26,306,100 | 5,573,311 | 7,431,466 | 127.57 | 101.28 | 512 | 11,452 | |||||||||||||
| (1) | Our CEO, Wendell P. Weeks, served as our |
| a. | For 2023, Edward A. Schlesinger, Lawrence D. McRae, Eric S. Musser and Lewis A. Steverson. |
| b. | For 2022, R. Tony Tripeny (who served for four months in 2022), Edward A. Schlesinger, Lawrence D. McRae, Eric S. Musser and Lewis A. Steverson. |
| c. | For 2021, R. Tony Tripeny, Lawrence D. McRae, Eric S. Musser and Lewis A. Steverson. |
| d. | For 2020, R. Tony Tripeny, Lawrence D. McRae, James P. Clappin and Eric S. Musser |
(2) | For each year, the values included in columns (c) and (e) for the compensation actually paid to our CEO and the average compensation paid to our non-CEO NEOs reflect the following adjustments to the values included in column (b) and column (d), respectively: |
| Reconciliation of Summary Compensation Totals and Compensation Actual Paid | 2023 | 2022 | 2021 | 2020 | ||||||||||||||||||||||
| CEO | Average Non-CEO NEOs | CEO | Average Non-CEO NEOs | CEO | Average Non-CEO NEOs | CEO | Average Non-CEO NEOs | |||||||||||||||||||
| Summary Compensation Table Total for CEO (column (b)) | $15,627,653 | $5,062,725 | $ | 16,169,469 | $ | 4,271,097 | $ | 20,766,032 | $ | 6,421,907 | $ | 18,951,753 | $ | 5,573,311 | ||||||||||||
| +/- Net Change in Pension Value | -327,691 | -229,731 | -13,662 | 174,240 | -12,790 | -129,044 | -1,341,183 | -503,540 | ||||||||||||||||||
| +/- Net Change in Stock Awards Value | -2,487,192 | -834,429 | -7,362,526 | -1,767,045 | 5,119,430 | 1,318,544 | 7,354,059 | 1,953,404 | ||||||||||||||||||
| +/- Net Change in Option Award Value | -14,116 | -5,049 | -48,980 | -33,259 | 1,273,553 | 319,111 | 1,341,470 | 408,292 | ||||||||||||||||||
| Compensation Actually Paid | 12,798,655 | 3,993,516 | 8,744,301 | 2,645,033 | 27,146,225 | 7,930,517 | 26,306,100 | 7,431,466 | ||||||||||||||||||
| CORNING 2024 PROXY STATEMENT | 91 |
Other Information
For each year, the value of stock awards and stock option awards used to calculate Compensation Actually Paid reflect the following assumptions:
| 2023 | 2022 | 2021 | 2020 | |
| Restricted Stock Units | ||||
| Stock Price | $30.45 - $34.78 | $31.94 - $35.54 | $37.23 - $45.90 | $19.99 - $36.00 |
| Performance Stock Units | ||||
| Stock Price | $30.45 - $34.78 | $31.94 - $35.54 | $37.23 - $44.28 | $36.00 |
| Performance Multiplier | 0.49 – 1.99 | 0.49 – 1.99 | 1.00 – 1.81 | 1.00 – 1.81 |
| Stock Options Stock Options [Member] | ||||
| Stock Price | $31.20 | $31.94 - $37.23 | $37.23 - $44.28 | $20.54 - $36.00 |
| Expected Life | – | – | – | |
| Risk-Free Rate | - | - | - | |
| Volatility | - | - | - | |
| Dividend Yield | - | - | - | |
3) | For each year, total shareholder return is shown for the Company, |
| Reconciliation of Summary Compensation Table Totals and Compensation Actually Paid | 2022 | 2021 | 2020 | |||||||||||||||||
| CEO | Average Non-CEO NEOs | CEO | Average Non-CEO NEOs | CEO | Average Non-CEO NEOs | |||||||||||||||
| Summary Compensation Table Total for CEO (column (b)) | $ | 16,169,469 | $ | 4,271,097 | $ | 20,766,032 | $ | 6,421,907 | $ | 18,951,753 | $ | 5,573,311 | ||||||||
| - Deduction for change in actuarial present values reported under the “Change in Pension Value and Nonqualified Deferred Compensation Earnings” column of the Summary Compensation Table for applicable Fiscal Year (FY) | 0 | 0 | 0 | 255,097 | 1,330,636 | 496,479 | ||||||||||||||
| + Increase for service cost or prior service cost for pension plans | (13,662) | 174,240 | (12,790) | 126,053 | 10,547 | (7,061) | ||||||||||||||
| - Deduction for amounts reported under the “Stock Awards” column in the Summary Compensation Table for applicable FY | 10,661,224 | 2,522,299 | 8,023,645 | 2,143,648 | 8,417,516 | 2,341,980 | ||||||||||||||
| - Deduction for amounts reported under the “Option Awards” column in the Summary Compensation Table for applicable FY | 0 | 0 | 0 | 0 | 151,467 | 60,748 | ||||||||||||||
| 92 | CORNING |
Other Information
| Reconciliation of Summary Compensation Table Totals and Compensation Actually Paid | 2022 | 2021 | 2020 | |||||||||||||||||
| CEO | Average Non-CEO NEOs | CEO | Average Non-CEO NEOs | CEO | Average Non-CEO NEOs | |||||||||||||||
| + Increase based on ASC 718 Fair Value of Awards Granted during applicable FY that remain unvested as of applicable fiscal year end (FYE), determined as of applicable FYE(a) | 6,089,648 | 1,328,135 | 10,703,253 | 2,837,131 | 15,516,697 | 4,319,061 | ||||||||||||||
| + Increase based on ASC 718 Fair Value of Awards Granted during applicable FY that vested during applicable FY, determined as of vesting date(b) | 0 | 45,669 | 0 | 0 | 0 | 0 | ||||||||||||||
| [+/-] Increase/deduction for awards granted during prior FY that were outstanding and unvested as of applicable FYE, determined based on change in ASC 718 Fair Value from prior FYE to applicable FYE(c) | (3,397,936) | (704,770) | 743,867 | 195,479 | 2,449,382 | 612,343 | ||||||||||||||
| [+/-] Increase/deduction for awards granted during prior FY that vested during applicable FY, determined based on change in ASC 718 Fair Value from prior FYE to vesting date(d) | (329,894) | (122,173) | 2,236,925 | 556,688 | (1,218,655) | (304,665) | ||||||||||||||
| - Deduction of ASC 718 Fair Value of awards granted during prior FY that were forfeited during applicable FY, determined as of prior FYE(e) | 0 | 18,243 | 0 | 0 | 0 | 0 | ||||||||||||||
| + Increase based on dividends or other earnings paid during applicable FY prior to the vesting date | 929,966 | 205,423 | 732,584 | 192,005 | 517,089 | 137,683 | ||||||||||||||
| + Increase based on incremental fair value of options/SARs modified during applicable FY | 0 | 0 | 0 | 0 | 0 | 0 | ||||||||||||||
| Compensation Actually Paid to CEO | 8,786,398 | 2,657,079 | 27,146,225 | 7,930,517 | 26,306,100 | 7,431,466 | ||||||||||||||
| As of Fiscal Year Ending December 31, | Award | Grant Date | FYE Price per Share ($) | Performance Payout | |||||||
| 2022 | 2022 Performance Stock Units – Tranche 1 | April 1, 2022 | $31.94 | 49% | (1) | ||||||
| 2022 | 2021 Performance Stock Units – Tranche 2 | February 2, 2022 | 31.94 | 49% | (1) | ||||||
| 2022 | 2020 Performance Stock Units – Tranche 3 | February 2, 2022 | 31.94 | 53.9% | |||||||
| 2021 | 2021 Performance Stock Units – Tranche 1 | April 1, 2021 | 37.23 | 175% | (1) | ||||||
| 2021 | 2020 Performance Stock Units – Tranche 2 | February 3, 2021 | 37.23 | 181% | (1) | ||||||
| 2020 | 2020 Performance Stock Units – Tranche 1 | April 1, 2020 | 36.00 | 181% | (1) | ||||||
| 2020 | Performance Incentive Plan – Performance Stock Units | May 15, 2020 | 36.00 | 100% |
For each year, the calculated increase based on ASC 718 Fair Value of time-based restricted stock awards granted during the applicable FY that remained unvested as of applicable FYE, reflect the following assumptions:
| As of Fiscal Year Ending December 31, | Award | Grant Date | FYE Price | |||||
| 2022 | 2022 Time-Based Restricted Stock Units | April 1, 2022 | $31.94 | |||||
| 2021 | 2021 Time-Based Restricted Stock Units | April 1, 2021 | 37.23 | |||||
| 2020 | 2020 Time-Based Restricted Stock Units | April 1, 2020 | 36.00 | |||||
| 2020 | 2020 Time-Based Restricted Stock Units(1) | June 15, 2020 | 36.00 | |||||
| 2020 | 2020 SSSO – Time-Based Restricted Stock Units | May 15, 2020 | 36.00 |
Other Information
For each year, the calculated increase based on ASC 718 Fair Value of stock option awards granted during the applicable FY that remained unvested as of applicable FYE, reflect the following assumptions:
| As of Fiscal Year Ending December 31, | Award | Grant Date | FYE Price per Share | Expected Life | Risk-Free Rate | Volatility | Dividend Yield | |||||||||
| 2020 | 2020 SSSO – Stock Options | May 15, 2020 | $36.00 | 6.82 | 0.62% | 29.81% | 2.44% |
| As of Fiscal Year Ending December 31, | Award | Grant Date | Vesting Date | Vesting Date Price per Share | ||||||
| 2022 | 2022 Time-Based Restricted Stock Units(1) | April 1, 2022 | November 1, 2022 | $32.56 |
| As of Fiscal Year Ending December 31, | Award | Grant Date | FYE Price per Share ($) | Performance Payout | |||||||
| 2022 | 2021 Performance Stock Units – Tranche 1 | April 1, 2021 | $31.94 | 175% | (1) | ||||||
| 2022 | 2020 Performance Stock Units – Tranche 1 | April 1, 2020 | 31.94 | 199% | (1) | ||||||
| 2022 | 2020 Performance Stock Units – Tranche 2 | February 3, 2021 | 31.94 | 192.5% | |||||||
| 2022 | 2020 Performance Incentive Plan – Performance Stock Units – Tranche 3 | May 15, 2020 | 31.94 | 100% | |||||||
| 2021 | 2020 Performance Stock Units – Tranche 1 | April 1, 2020 | 37.23 | 181% | (1) | ||||||
| 2021 | 2020 Performance Incentive Plan – Performance Stock Units- Tranche 2 | May 15, 2020 | 37.23 | 100% | |||||||
| 2021 | 2020 Performance Incentive Plan – Performance Stock Units – Tranche 3 | May 15, 2020 | 37.23 | 100% |
For each year, the calculated increase (deduction) for time-based restricted stock awards granted during a prior FY that were outstanding and unvested as of the applicable FYE, determined based on change in ASC 718 Fair Value from the prior FYE to applicable FYE, reflect the following assumptions:
| As of Fiscal Year Ending December 31, | Award | Grant Date | FYE Price | |||||
| 2022 | 2021 Time-Based Restricted Stock Units | April 1, 2021 | $31.94 | |||||
| 2022 | 2020 Time-Based Restricted Stock Units | April 1, 2020 | 31.94 | |||||
| 2022 | 2020 Time-Based Restricted Stock Units(1) | June 15, 2020 | 31.94 | |||||
| 2022 | 2020 SSSO – Time-Based Restricted Stock Units – Tranche 3 | May 15, 2020 | 31.94 | |||||
| 2021 | 2020 Time-Based Restricted Stock Units | April 1, 2020 | 37.23 | |||||
| 2021 | 2020 Time-Based Restricted Stock Units(1) | June 15, 2020 | 37.23 | |||||
| 2021 | 2019 Time-Based Restricted Stock Units | April 1, 2019 | 37.23 | |||||
| 2021 | 2020 SSSO – Time-Based Restricted Stock Units – Tranche 2 | May 15, 2020 | 37.23 | |||||
| 2021 | 2020 SSSO – Time-Based Restricted Stock Units – Tranche 3 | May 15, 2020 | 37.23 | |||||
| 2020 | 2019 Time-Based Restricted Stock Units | April 1, 2019 | 36.00 | |||||
| 2020 | 2018 Time-Based Restricted Stock Units | April 2, 2018 | 36.00 |
Other Information
For each year, the calculated increase (deduction) for stock option awards granted during a prior FY that were outstanding and unvested as of the applicable FYE, determined based on change in ASC 718 Fair Value from the prior FYE to applicable FYE, reflect the following assumptions:
| As of Fiscal Year Ending December 31, | Award | Grant Date | FYE Price per Share | Expected Life | Risk-Free Rate | Volatility | Dividend Yield | |||||||||
| 2021 | 2020 SSSO – Stock Options | May 15, 2020 | $37.23 | 5.82 | 1.33% | 30.91% | 2.58% | |||||||||
| 2021 | 2019 Stock Options | April 1, 2019 | 37.23 | 4.73 | 1.22% | 32.90% | 2.58% | |||||||||
| 2020 | 2019 Stock Options | April 1, 2019 | 36.00 | 5.73 | 0.47% | 31.10% | 2.44% | |||||||||
| 2020 | 2018 Stock Options | April 2, 2018 | 36.00 | 4.73 | 0.33% | 32.07% | 2.44% |
| As of Fiscal Year Ending December 31, | Award | Grant Date | Vesting Date | Vesting Date | Performance Payout | |||||||
| 2022 | 2020 Performance Incentive Plan – Performance Stock Units – Tranche 2 | May 15, 2020 | May 15, 2022 | $35.54 | 100% | |||||||
| 2021 | 2020 Performance Stock Units – Tranche 1 | May 15, 2020 | May 15, 2021 | 44.28 | 100% |
For each year, the calculated increase (deduction) for time-based restricted stock awards granted during a prior FY that were vested as of the applicable FYE, determined based on change in ASC 718 Fair Value from the prior FYE to applicable vesting date, reflect the following assumptions:
| As of Fiscal Year Ending December 31, | Award | Grant Date | Vesting Date | Vesting Date | ||||||
| 2022 | 2020 SSSO – Time-Based Restricted Stock Units – Tranche 2 | May 15, 2020 | May 15, 2022 | $35.54 | ||||||
| 2022 | 2020 Time-Based Restricted Stock Units(1) | June 15, 2020 | June 15, 2022 | 32.74 | ||||||
| 2022 | 2019 Time-Based Restricted Stock Units | April 1, 2019 | April 15, 2022 | 33.69 | ||||||
| 2022 | 2021 Time-Based Restricted Stock Units(2) | April 1, 2021 | November 1, 2022 | 32.56 | ||||||
| 2022 | 2020 Time-Based Restricted Stock Units(2) | April 1, 2020 | November 1, 2022 | 32.56 | ||||||
| 2021 | 2020 SSSO – Time-Based Restricted Stock Units – Tranche 1 | May 15, 2020 | May 15, 2021 | 44.28 | ||||||
| 2021 | 2020 Time-Based Restricted Stock Units(1) | June 15, 2020 | June 15, 2021 | 41.02 | ||||||
| 2021 | 2018 Time-Based Restricted Stock Units | April 2, 2018 | April 15, 2021 | 45.90 | ||||||
| 2020 | 2017 Time-Based Restricted Stock Units | March 31, 2017 | April 15, 2020 | 19.99 |
For each year, the calculated increase (deduction) for stock option awards granted during a prior FY that were vested as of the applicable FYE, determined based on change in ASC 718 Fair Value from the prior FYE to applicable vesting date, reflect the following assumptions:
| As of Fiscal Year Ending December 31, | Award | Grant Date | Vesting Date | Vesting | Expected Life | Risk-Free Rate | Volatility | Dividend Yield | ||||||||||
| 2022 | 2020 SSSO – Stock Options – Tranche 2 | May 15, 2020 | May 15, 2022 | $35.54 | 5.4 | 2.90% | 32.24% | 3.04% | ||||||||||
| 2022 | 2019 Stock Options | April 1, 2019 | April 1, 2022 | 36.36 | 4.4 | 2.57% | 34.37% | 2.97% | ||||||||||
| 2021 | 2020 SSSO – Stock Options – Tranche 1 | May 15, 2020 | May 15, 2021 | 44.28 | 6.4 | 1.15% | 30.78% | 2.17% | ||||||||||
| 2021 | 2018 Stock Options | April 2, 2018 | April 2, 2021 | 43.99 | 4.4 | 0.80% | 33.20% | 2.18% | ||||||||||
| 2020 | 2017 Stock Options | March 31, 2017 | March 31, 2020 | 20.54 | 4.4 | 0.35% | 30.33% | 4.28% |
Other Information
Pay Versus Performance Relationship
The following comparisons describe the relationships between the amounts included in the Pay Versus Performance Table for each of 2023, 2022, 2021 and 2020, including a comparison between our cumulative total shareholder return and the total shareholder return of the Comparison Group and comparisons between the compensation actually paid to the CEO and the average compensation actually paid to our non-CEO NEOs and (ii) each of the performance measures set forth in columns (f), (h) and (i) of the Pay Versus Performance Table.Restricted Stock Units [Member]
S&P 500 Communications Equipment TSR | Indexed TSR | |
 |
| |
GAAP Net Income | Core Revenue | |
 |  |
Most Important Financial Measures Used to Link Compensation Actually Paid to our NEOs to Company Performance in 20222023
The following table identifies the six most important financial performance measures used by the Committee to link the compensation actually paid to our CEO and other NEOs in 20222023 to company performance. The role of each of these performance measures in our NEOs’ compensation is discussed in the CD&A above.
| Financial Performance Measures |
| Core Net Sales |
| Core Earnings Per Share |
| Adjusted Free Cash Flow |
| Return on Invested Capital (ROIC) |
| Core Gross Margin |
| Core NPAT |
| CORNING |

The Audit Committee evaluates our independent registered public accounting firm each year and has appointed PricewaterhouseCoopers LLP (PwC) as our independent registered public accounting firm for 2023.2024. PwC has served in this role since 1944. The Audit Committee concluded that many factors contribute to the continued support of PwC’s independence, such as the oversight of the Public Company Accounting Oversight Board (PCAOB) through the establishment of audit, quality, ethics, and independence standards in addition to conducting audit inspections; the mandating of reports on internal control over financial reporting; PCAOB requirements for audit partner rotation; and limitations imposed by regulation and by the Audit Committee on non-audit services provided by PwC. The Audit Committee preapproves all audit and permitted non-audit services that PwC performs for the Company, and it approves the fees associated with the engagement of PwC. All services provided to Corning by PwC in 20212022 and 20222023 were pre-approved by the Audit Committee in accordance with the policy.
The Audit Committee and the PCAOB require key PwC partners assigned to our audit to be rotated at least every five years. The Audit Committee and its Chair oversee the selection process for each new lead engagement partner. Throughout this process, the Audit Committee and management provide input to PwC about the Company’s priorities, discuss candidate qualifications and interview potential candidates put forth by PwC.
In determining whether to reappoint PwC, the Audit Committee took into consideration a number of factors, including:
| • | PwC’s global capabilities to handle the breadth and complexity of Corning’s global operations; |
| • | PwC’s technical expertise and knowledge of Corning’s industry and global operations; |
| • | The quality and candor of PwC’s communications with the Audit Committee and management, which include routine executive sessions with the Audit Committee held without management present and a management survey of PwC’s performance; |
| • | PwC’s independence; |
| • | The appropriateness of PwC’s fees; and |
| • | PwC’s tenure as our independent registered public accounting firm, including the benefits of that tenure (including higher audit quality due to PwC’s deep understanding of Corning’s business and accounting policies and practices), the avoidance of significant costs and disruptions that would be associated with retaining a new independent auditor, and the controls and processes in place such as rotation of key partners and an annual assessment of PwC’s qualifications, service quality, sufficiency of resources, quality of communications, working relationship with our management, objectivity and professional skepticism that help ensure PwC’s continued independence. |
| CORNING |
Proposal 3 Ratification of Appointment of Independent Registered Public Accounting Firm
Based on its evaluation, the Audit Committee believes that the continued retention of PwC is in the best interests of the Company and its shareholders. The Board concurs and requests that the shareholders ratify the appointment of PwC as Corning’s independent registered public accounting firm for the fiscal year ending December 31, 2023.2024. If the selection of PwC is not ratified by a majority of the votes cast by the holders of shares entitled to vote on the matter, the Audit Committee will review its future selection of an independent registered public accounting firm in light of that vote result. Even if the selection is ratified, the Audit Committee in its discretion may appoint a different registered public accounting firm at any time during the year if the Audit Committee determines that such change would be appropriate.
Corning expects representatives of PwC to be present at the Annual Meeting and available to respond to questions that may be raised there. These representatives may comment on the financial statements if they so desire.
 | FOR | Our Board unanimously recommends a vote FOR the ratification of the appointment of PricewaterhouseCoopers LLP as our independent registered public accounting firm for the fiscal year ending December 31, |
Fees Paid to Independent Registered Public Accounting Firm
Aggregate fees for professional services rendered by PwC in 20212022 and 2022:2023:
| 2021 | 2022 | ||||||
| Audit Fees | $ | 9,503,000 | $ | 9,918,000 | |||
| Audit-Related Fees | 300,000 | 311,000 | |||||
| Tax Fees | 558,000 | 487,000 | |||||
| All Other Fees | 13,000 | 65,000 | |||||
| Total Fees | $ | 10,374,000 | $ | 10,781,000 |
| 2023 | 2022 | ||||||
| Audit Fees | $ | 9,825,000 | $ | 9,918,000 | |||
| Audit-Related Fees | 188,000 | 311,000 | |||||
| Tax Fees | 504,000 | 487,000 | |||||
| All Other Fees | 10,000 | 65,000 | |||||
| Total Fees | $ | 10,527,000 | $ | 10,781,000 |
Audit Fees. These fees are composed of professional services rendered in connection with the annual audit of Corning’s consolidated financial statements, including the audit of the effectiveness of internal control over financial reporting, and reviews of Corning’s quarterly consolidated financial statements on Form 10-Q that are customary under the PCAOB auditing standards. Audit fees also include statutory audits, comfort letters, consents for other SEC filings and reviews of documents filed with the SEC.
Audit-Related Fees. These fees are composed of professional services rendered in connection with due diligence pertaining to acquisitions, procedures to translate certain financial statements for foreign subsidiaries, employee benefit plan audits, agreed-upon procedures, and other audit-related activities.
Tax Fees. These fees are composed of statutory tax compliance, assistance for Corning’s foreign jurisdiction subsidiaries’ tax returns, tax transfer pricing services, and other tax consulting projects.
All Other Fees. Consists of fees not included in the Audit, Audit-Related, or Tax categories, including licensing technical accounting software from the independent registered public accounting firm.
| CORNING |
Proposal 3 Ratification of Appointment of Independent Registered Public Accounting Firm
Policy Regarding Audit Committee Pre-Approval of Audit and
Permitted Non-Audit Services of Independent Registered
Public Accounting Firm
The Audit Committee has adopted a policy for pre-approval of audit and permitted non-audit services by Corning’s independent registered public accounting firm. The full Audit Committee approves annually projected services and fee estimates for these services and other major types of services. The Audit Committee chair has been designated by the Audit Committee to approve any services arising during the year that were not pre-approved by the Audit Committee and services that were pre-approved, but for which the associated fees will materially exceed the budget established for the type of service at issue. Services approved by the chair are communicated to the full Audit Committee at its next regular meeting. For each proposed service, the independent registered public accounting firm is required to provide supporting documentation detailing said service and confirm that the provision of such services does not impair its independence. The Audit Committee regularly reviews reports detailing services provided to Corning by its independent registered public accounting firm.
Report of the Audit Committee
The purpose of the Audit Committee is to assist the Board of Directors in its general oversight of Corning’s financial reporting, internal controls and audit functions. The Audit Committee operates under a written charter adopted by the Board of Directors. The directors who serve on the Audit Committee have no financial or personal ties to Corning (other than director compensation and equity ownership as described in this proxy statement) and are all “financially literate” and “independent” for purposes of the New York Stock Exchange listing standards. The Board of Directors has determined that none of the Audit Committee members has a relationship with Corning that may interfere with the members’ independence from Corning and its management.
The Audit Committee met with management periodically during the year to consider the adequacy of Corning’s internal controls and the objectivity of its financial reporting. The Audit Committee discussed these matters with Corning’s independent registered public accounting firm and with the appropriate financial personnel and internal auditors. The Audit Committee also discussed with Corning’s senior management and independent registered public accounting firm the process used for certifications by Corning’s chief executive officer and chief financial officer that are required for certain of Corning’s filings with the SEC. The Audit Committee met privately with both the independent registered public accounting firm and the internal auditors, both of whom have unrestricted access to the Audit Committee.
The Audit Committee has reviewed and discussed the consolidated financial statements with management and the independent registered public accounting firm. Management is responsible for: the preparation, presentation and integrity of Corning’s financial statements; accounting and financial reporting principles; establishing and maintaining disclosure controls and procedures (as defined in Exchange Act Rule 13a-15(e)); establishing and maintaining internal control over financial reporting (as defined in Exchange Act Rule 13a-15(f)); evaluating the effectiveness of disclosure controls and procedures; evaluating the effectiveness of internal control over financial reporting; and evaluating any change that has materially affected, or is reasonably likely to materially affect, internal control over financial reporting. The independent registered public accounting firm is responsible for performing an independent audit of the consolidated financial statements and expressing an opinion on the conformity of those financial statements with accounting principles generally accepted in the United States, as well as expressing an opinion on the effectiveness of internal control over financial reporting.
During the course of 2022,2023, management updated the documentation, and performed testing and evaluation of Corning’s system of internal control over financial reporting in response to the requirements set forth in Section 404 of the Sarbanes-Oxley Act of 2002 and related regulations. The Audit Committee was kept apprised of the progress of the evaluation, and it provided oversight and advice to management during the process. In connection with this oversight, the Audit Committee received periodic updates provided by management, internal audit and the independent registered public accounting firm at each regularly scheduled Audit Committee meeting. At the conclusion of the process, management provided the Audit Committee with, and the Audit Committee reviewed a report on, the effectiveness of Corning’s internal control over financial reporting. The Audit Committee also reviewed: the report of management contained in Corning’s Annual Report on Form 10-K for the year ended December 31, 2022,2023, filed with the SEC; as well as PricewaterhouseCoopers LLP’s Report of Independent Registered Public Accounting Firm included in Corning’s Annual Report
| CORNING |
Proposal 3 Ratification of Appointment of Independent Registered Public Accounting Firm
in Corning’s Annual Report on Form 10-K for the year ended December 31, 20222023 related to its audits of the consolidated financial statements and financial statement schedule, and the effectiveness of internal control over financial reporting.
The Audit Committee has discussed with the independent registered public accounting firm the matters required by the applicable requirements of the Public Company Accounting Oversight Board and the SEC. In addition, the Audit Committee has received from the independent registered public accounting firm the written disclosures and the letter required by applicable requirements of the Public Company Accounting Oversight Board regarding the independent registered public accounting firm’s communications with the Audit Committee concerning independence and discussed with them their independence from Corning and its management. The Audit Committee has considered whether the provision of permitted non-audit services by the independent registered public accounting firm to Corning is compatible with the auditor’s independence.
Based on these reviews and discussions, the Audit Committee recommended to the Board of Directors and the Board of Directors approved that the audited financial statements be included in Corning’s Annual Report on Form 10-K for the year ended December 31, 2022.2023.
The Audit Committee:
Kurt M. Landgraf, Chair
Donald W. Blair
Leslie A. Brun
Stephanie A. Burns
Pamela J. Craig
Thomas D. French
| CORNING |
![]()
As described in Proposal 2 above, Corning’s shareholders are being provided the opportunity to cast an advisory vote on Corning’s executive compensation program. The advisory vote on executive compensation described in Proposal 2 above is referred to as a “say-on-pay vote.” Section 14A(a)(2) of the Securities Exchange Act of 1934 requires public companies to solicit the preference of their shareholders as to whether future say-on-pay votes should be held ever one, two, or three years no later than the annual meeting of shareholders held in the sixth calendar year after the last such vote.
Our last advisory vote on the frequency of our say-on-pay vote was held at our 2017 Annual Meeting, where shareholders voted to hold say-on-pay votes every year. Accordingly, this Proposal 4 affords shareholders the opportunity to cast an advisory vote on how often Corning should include a say-on-pay vote in its proxy materials for future annual shareholder meetings (or special shareholder meeting for which Corning must include executive compensation information in the proxy statement for that meeting).
Under this Proposal 4, shareholders may vote to have the say-on-pay vote every year, every two years or every three years. Our Board believes that say-on-pay votes should be conducted every year so that shareholders may annually express their views on our executive compensation program. Our shareholders have also overwhelmingly supported annual say-on-pay voting. The Compensation and Talent Management Committee, which administers Corning’s executive compensation program, values the opinions expressed by shareholders in these votes and will continue to consider the outcome of these votes in making its decisions on executive compensation.
 |


Why Did You Send Me This Proxy Statement?
We sent this proxy statement and the enclosed proxy card to you because our Board of Directors is soliciting your proxy to vote at the Annual Meeting. This proxy statement summarizes information concerning the matters to be presented at the meeting and related information that will help you make an informed vote. This proxy statement and the accompanying proxy card are first being distributed or made available to shareholders on or about March 17, 2023.22, 2024.
When and Where Is the Annual Meeting?
Our Board of Directors has determined to hold the Annual Meeting in a virtual-only format on Thursday, April 27, 2023May 2, 2024 at 12 noon Eastern Time at virtualshareholdermeeting.com/GLW2023GLW2024. You will not be able to attend the Annual Meeting physically.
You are entitled to participate in the Annual Meeting if you were a shareholder as of the close of business on February 28, 2023.March 5, 2024. The live audio webcast of the Annual Meeting will begin promptly at 12 noon Eastern Time. Online access to the audio webcast will open 30 minutes prior to the start ofbefore the Annual Meeting.Meeting starts. We encourage you to access the meeting in advance of the designated start time.
We urge you to vote and submit your proxy in advance of the meeting using one of the methods described in the proxy materials whether or not you plan to attend the Annual Meeting. You may vote your shares at ProxyVote.com in advance of the Annual Meeting. This process has not changed from prior years.
Who May Attend the Annual Meeting?
The Annual Meeting is open to holders of shares of our common stock who held such shares as of the meeting’s record date, February 28, 2023.March 5, 2024. To attend and vote your shares during the Annual Meeting, you will need to log in to virtualshareholdermeeting.com/GLW2023GLW2024 using, (i) for record holders, the control number found on your proxy card or the notice you previously received, or (ii) for holders who own shares in street name through brokers, the control number issued to you by your brokerage firm. You may vote during the Annual Meeting by following the instructions available on the meeting website during the meeting. If you do not have a control number, you may log in as a guest, although you will not be able to vote during the Annual Meeting.
What Am I Voting On?
The following matters are scheduled for vote at the Annual Meeting:
| • | Election of each of the |
| • | Advisory approval of our executive compensation (Say on Pay); |
CORNING 2023 proxy statement
Frequently Asked Questions About the Meeting and Voting
| • | Ratification of the appointment of PricewaterhouseCoopers LLP as our independent registered public accounting firm for the fiscal year ending December 31, |
| • | ||
| Any other business or action which may properly come before the Annual Meeting or any adjournment or postponement of the Annual Meeting. |
| 98 | CORNING 2024 PROXY STATEMENT |
Proposal 3 Frequently Asked Questions About the Meeting and Voting
How Do You Recommend That I Vote on These Items?
The Board of Directors recommends that you vote your shares:
| • | FOR each of the 14 director nominees (Proposal 1); |
| • | FORthe advisory approval of our executive compensation, as such information is disclosed in the Compensation Discussion & Analysis, the compensation tables and the accompanying disclosure (Say on Pay) (Proposal 2); and |
| • | FOR ratification of the Audit Committee’s appointment of PricewaterhouseCoopers LLP as our independent registered public accounting firm for the fiscal year ending December 31, | |
Who is Entitled to Vote?
You may vote if you owned shares of our common stock as of the close of business on February 28, 2023,March 5, 2024, the record date for the Annual Meeting.
How Many Votes Do I Have?
You are entitled to one vote for each share of common stock you own. As of the close of business on February 28, 2023,March 5, 2024, we had 847,231,784855,352,470 shares of common stock outstanding. The shares held in our treasury are not considered outstanding and will not be voted or considered present at the meeting.
How Do I Vote By Proxy Before the Annual Meeting?
Before the meeting, registered shareholders may vote shares in one of the following three ways:
| • | By Internet at ProxyVote.com; |
| • | By telephone (from the United States and Canada only) at 1-(800)-690-6903; or |
| • | By mail by completing, signing, dating and returning the enclosed proxy card in the postage paid envelope provided (see |
Please refer to the proxy card for further instructions on voting by Internet or telephone.
Please use only one of the three ways to vote.
If you hold shares in the account of or name of a broker, your ability to vote those shares by Internet and telephone depends on the voting procedures used by your broker, as explained below under “How Do I Vote If My Broker Holds My Shares In Street Name?”
Frequently Asked Questions About the Meeting and Voting
How Do I Vote My Shares During the Annual Meeting?
Even if you plan to attend and participate in our virtual Annual Meeting, we encourage you to vote by telephone or over the Internet, or by returning a proxy card following your request for printed materials. This will ensure that your vote will be counted if you are unable to, or later decide not to, participate in the virtual Annual Meeting. Whether you are a shareholder of record or hold your shares in “street name,” you may vote online at the Annual Meeting. You will need to enter your control number (included in your notice, your proxy card or the voting instructions that accompanied your proxy materials) to vote your shares at the Annual Meeting.
| CORNING 2024 PROXY STATEMENT | 99 |
Proposal 3 Frequently Asked Questions About the Meeting and Voting
May I Change My Mind After I Vote?
Yes. You may change your vote or revoke your proxy at any time before the polls close at the meeting. You may change your vote by:
| • | voting again by Internet or telephone prior to the meeting; |
| • | voting again at the meeting; or |
| • | signing another proxy card with a later date and returning it to Corning’s Corporate Secretary at One Riverfront Plaza, Corning, NY 14831, prior to the meeting. |
You also may revoke your proxy prior to the meeting without submitting any new vote by sending a written notice that you are withdrawing your vote to our Corporate Secretary at the address listed above.
What Shares Are Included on My Proxy Card?
Your proxy card includes shares held in your own name and shares held in any Corning plan. You may vote these shares by Internet, telephone or mail, as described on your proxy card or the notice you previously received. Your proxy card does not include any shares held in a brokerage account in the name of your bank or broker (such shares are said to be held in “street name”).
How Do I Vote if I Participate in the Corning Investment Plan?
If you hold shares in the Corning Investment Plan, which includes shares held in the Corning Stock Fund in the Company’s 401(k) plan, these shares have been added to your other holdings on your proxy card. Your completed proxy card serves as voting instructions to the trustee of the plan. You may direct the trustee to vote your plan shares by submitting your proxy vote for those shares, along with the rest of your shares, by Internet, telephone or mail, all as described on your proxy card or the notice you previously received. If you do not instruct the trustee to vote, your plan shares will be voted by the trustee in the same proportion that it votes shares in other plan accounts for which it did receive timely voting instructions.
How Do I Vote if My Broker Holds My Shares in “Street Name”?
If your shares are held in a brokerage account in the name of your bank or broker (this is called “street name”), those shares are not included in the total number of shares listed as owned by you on the enclosed proxy card. Instead, your bank or broker will send you directions on how to vote those shares.
Will My Shares Held in Street Name Be Voted if I Do Not
Provide My Proxy?
Under the New York Stock Exchange rules, if you own shares in “street name” through a broker and do not vote, your broker may not vote your shares on proposals determined to be “non-routine.” In such cases, the absence of voting instructions results in a “broker non-vote.” Broker non-voted shares count toward achieving a quorum requirement for the Annual Meeting, but they do not affect the determination of whether the non-routine matter is approved or rejected.
Frequently Asked Questions About the Meeting and Voting
The proposal to ratify the appointment of PricewaterhouseCoopers LLP as our independent registered public accounting firm is the only matter in this proxy statement considered to be a routine matter for which brokers will be permitted to vote on behalf of their clients, if no voting instructions are furnished. Since Proposals 1 2 and 42 are non-routine matters, broker non-voted shares will not count as votes cast to affect the determination of whether those proposals are approved or rejected. Therefore, it is important that you provide voting instructions to your broker.
| 100 | CORNING 2024 PROXY STATEMENT |
Proposal 3 Frequently Asked Questions About the Meeting and Voting
What if I Return My Proxy Card or Vote by Internet or
Telephone but Do Not Specify How I Want to Vote?
If you sign and return your proxy card or complete the Internet or telephone voting procedures, but do not specify how you want to vote your shares, we will vote them as follows:
| • | FOR each of the 14 director nominees (Proposal 1); |
| • | FORthe advisory approval of our executive compensation, as such information is disclosed in the Compensation Discussion & Analysis, the compensation tables and the accompanying disclosure (Say on Pay) (Proposal 2); and |
| • | FOR ratification of the Audit Committee’s appointment of PricewaterhouseCoopers LLP as our independent registered public accounting firm for the fiscal year ending December 31, | |
If you participate in the Corning Investment Plan and do not submit timely voting instructions, the trustee of the plan will vote the shares in your plan account in the same proportion that it votes shares in other plan accounts for which it did receive timely voting instructions, as explained above under the question “How Do I Vote If I Participate In The Corning Investment Plan?”
What Does it Mean if I Receive More Than One Proxy Card?
If you received more than one proxy card, you have multiple accounts with your brokers or our transfer agent. Please vote all of these shares. We recommend that you contact your broker or our transfer agent to consolidate as many accounts as possible under the same name and address. If you are the registered holder, you may contact our transfer agent, Computershare Trust Company, N.A., at 1-(800)-255-0461.
May Shareholders Ask Questions at the Virtual
Annual Meeting?
Yes. We have designed the format of the virtual Annual Meeting to ensure that our shareholders are afforded the same rights and opportunities to participate as they would have at an in-person meeting. After the business portion of the Annual Meeting concludes and the meeting is adjourned, we will hold a Q&A session during which we intend towill answer questions submitted during the meeting that are pertinent to the Company, as time permits, and in accordance with our Rules for Conduct of the Shareholder Meeting. During the Annual Meeting, you can view our Rules for Conduct of the Shareholder Meeting and submit any questions at virtualshareholdermeeting.com/GLW2023GLW2024. Answers to any questions not addressed during the meeting will be posted on the investor page of our website following the meeting. Questions and answers will be grouped by topic, and substantially similar questions will be answered only once.
How Many Shares Must be Present to Hold the Meeting?
In order for us to conduct our meeting, a majority of our outstanding shares of common stock as of February 28, 2023,March 5, 2024, the record date for the meeting, must be present in person (by logging in to our virtual annual meeting with your control number) or by proxy at the meeting. This is called a quorum. Your shares are counted as present at the meeting if you attend the virtual meeting by logging in with your control number or if you properly return a proxy by Internet, telephone or mail.
Proposal 3Frequently Asked Questions About the Meeting and Voting
What Is the Vote Required for Each Proposal?
| Affirmative Vote Required | Broker Discretionary Voting Allowed | |||||
| Proposal 1: Election of each of the | Majority of votes cast at the meeting in person or by proxy | No | ||||
| Proposal 2: Advisory approval of our executive compensation (Say on Pay) | Majority of votes cast at the meeting in person or by proxy | No | ||||
| Proposal 3: Ratification of the appointment of independent registered public accounting firm for fiscal year | Majority of votes cast at the meeting in person or by proxy | Yes | ||||
With respect to Proposals 1, 2 and 3 you may vote “FOR”, “AGAINST” or “ABSTAIN”. With respect to Proposal 4, you may vote “EVERY YEAR”, “EVERY 2 YEARS”,“EVERY 3 YEARS” or “ABSTAIN”. If you “ABSTAIN” from voting on any of these Proposals, the abstention will not constitute a vote cast.
How Will Voting on “Any Other Business” Be Conducted?
We have not received proper notice of, and are not aware of, any business to be transacted at the meeting other than as indicated in this proxy statement. If any other item or proposal properly comes before the meeting, the proxies received will be voted on those matters in accordance with the discretion of the proxy holders.
Who Pays for the Solicitation of Proxies?
Our Board of Directors is making this solicitation of proxies on behalf of the Company. The Company will pay the costs of the solicitation, including the costs for preparing, printing and mailing this proxy statement. We have hired Innisfree M&A Incorporated to assist us in soliciting proxies. It may do so by telephone, in person or by other electronic communications. We anticipate paying Innisfree a fee of $25,000 plus out-of-pocket expenses for these services. We also will reimburse brokers for their costs in sending proxies and proxy materials to our shareholders so that you may vote your shares. Our directors, officers and regular employees may supplement Innisfree’s proxy solicitation efforts by contacting you by telephone or electronic communication or in person. We will not pay directors, officers or other regular employees any additional compensation for their proxy solicitation efforts.
How Can I Find the Voting Results of the Annual Meeting?
Following the conclusion ofAfter the Annual Meeting, we will include the voting results in a Form 8-K, which we expect towill file with the SEC on or before May 3, 2023.
Frequently Asked Questions About the Meeting and Voting8, 2024.
Shareholder Proposals and Director Nominations for the 20242025 Annual Meeting
Under Rule 14a-8 of the Securities Exchange Act of 1934 (the Exchange Act), eligible shareholders may submit proposals for inclusion in the proxy statement for our 20242025 Annual Meeting. Shareholder proposals must comply with the requirements established by the SEC and must be submitted in writing and received by our Corporate Secretary on or before the close of business on November 21, 202322, 2024 (for them to be considered for inclusion in the 20242025 proxy statement).
Our by-laws permit a group of shareholders (up to 20) who have owned at least 3% of Corning’s common stock for at least 3 years to submit director nominees for the greater of two directors or the largest whole number that does not exceed 20% of our Board. These director nominees will be included in our proxy statement for the 20242025 Annual Meeting if the shareholder(s)
| 102 | CORNING 2024 PROXY STATEMENT |
Proposal 3 Frequently Asked Questions About the Meeting and Voting
and the nominee(s) satisfy the requirements specified in our by-laws. Notices of director nominees submitted under these by-law provisions must be received no earlier than December 29, 2023January 2, 2025 and no later than January 29, 2024.February 1, 2025.
If you would like to present a matter not included in our proxy statement for consideration at our 20242025 Annual Meeting, including nominations for director candidates, you must send advance written notice to our Corporate Secretary no earlier than the 120th day prior to the first anniversary of the preceding year’s annual meeting (December 29, 2023) and no later than the close of business on the 90th120th day prior to the first anniversary of the preceding year’s annual meeting (January 29, 2024)2, 2025) and no later than the close of business on the 90th day prior to the first anniversary of the preceding year’s annual meeting (February 1, 2025). Any matter or nomination must comply with our by-laws. Eligible shareholders who intend to solicit proxies for the 20242025 Annual Meeting in support of director nominees other than the Company’s nominees under Rule 14a-19 of the Exchange Act must comply with the requirements of the Company’s by-laws and provide the notice required by, and in compliance with, Rule 14a-19 no later than February 27, 2024.March 3, 2025.
All proposals in this section should be addressed to Corporate Secretary, Corning Incorporated, One Riverfront Plaza, Corning, New York 14831 and must be received by the applicable dates specified above.
Why Haven’t I Received a Printed Copy of the Proxy Statement or Annual Report?
We are furnishing proxy materials to you online, as permitted by SEC rules, to expedite your receipt of materials while lowering costs and reducing the environmental impact of printing and mailing full sets of annual meeting materials. If you received by mail a notice of the electronic availability of these materials, you will not receive a printed copy unless you specifically request it. Such notice contains instructions on how to request a paper copy of the materials.
Is the Proxy Statement Available on the Internet?
Yes. Most shareholders will receive the proxy statement and other annual meeting materials online. If you received a paper copy, you can also view these documents online by accessing our website at corning.com/2023-proxy2024-proxy. You can elect to receive future proxy statements and annual reports by Internet instead of receiving paper copies by mail by following the instructions for making such election when you electronically vote your shares.
Are You “Householding” for Shareholders Sharing the
Same Address?
Yes. The SEC’s rules regarding the delivery to shareholders of proxy statements, annual reports, prospectuses and information statements permit us to deliver a single copy of these documents to an address shared by two or more of our shareholders. This method of delivery is referred to as “householding,” and can significantly reduce our printing and mailing costs. It also reduces the volume of mail you receive. This year, we are delivering only one proxy statement and 20222023 Annual Report on Form 10-K to multiple registered shareholders sharing an address, unless we receive instructions to the contrary from one or more of the shareholders. We will still be required, however, to send you and each other shareholder
Frequently Asked Questions About the Meeting and Voting
at your address an individual proxy voting card. If you would like to receive more than one copy of this proxy statement and annual report, we will promptly send you additional copies upon written or oral request directed to Broadridge Financial Solutions, Inc. (“Broadridge”), either by calling toll free at (866) 540-7095 or by writing to Broadridge, Householding Department, 51 Mercedes Way, Edgewood, New York 11717. The same phone number and mailing address may be used to notify us that you wish to request delivery of a single copy of a proxy statement or Annual Report on Form 10-K if you are receiving multiple copies.
Code of Ethics
Our Board of Directors adopted (i) the Code of Ethics for the Chief Executive Officer and Financial Executives (Code of Ethics) and (ii) the Code of Conduct for Directors and Executive Officers, which supplement our Code of Conduct that governs all employees and directors.directors and (ii) the Code of Ethics for the Chief Executive Officer and Financial Executives (Code of Ethics). These Codes have been in existenceexisted for more thanover ten years. The Code of Ethics applies to our Chief Executive
| CORNING 2024 PROXY STATEMENT | 103 |
Proposal 3 Frequently Asked Questions About the Meeting and Voting
Officer, Chief Financial Officer, Controller and other financial executives. During 2022,2023, no amendments to or waivers of the provisions of the Code of Ethics provisions were made with respect tofor any of our directors or executive officers. A copy of the Code of Ethics is available on our website at http://www.corning.com/worldwide/en/about-us/investor-relations/codes-of-conduct-ethics.html.codes-of-conduct-ethics.html. We will disclose future amendments to, or waivers from, the Code of Ethics on our website within four business days following the date of such amendment or waiver.
Incorporation by Reference
The Compensation and Talent Management Committee Report on page 7675 is not deemed filed with the SEC and shall not be deemed incorporated by reference into any prior or future filings made by Corning under the Securities Act or the Exchange Act, except to the extent that Corning specifically incorporates such information by reference. In addition, this proxy statement includes several website addresses. Website references throughout this document are provided for convenience only and are intended to provide inactive, textual references only. The content on the referenced websites is not incorporated herein by reference and does not constitute a part of this proxy statement.
Additional Information
This proxy statement, our 20222023 Annual Report on Form 10-K, and all other filings with the SEC, each of the Board Committee Charters and the Corporate Governance Guidelines with Director Qualification Standards may be accessed via the Investor Relations page on Corning’s website at corning.com.
| 104 | CORNING |

CORNING INCORPORATED AND SUBSIDIARY COMPANIES
RECONCILIATION OF NON-GAAP MEASURES
Year Ended December 31, 20222023
(Unaudited; amountsAmounts in millions, except per share amounts)
| Net Sales | Gross Margin | Net income attributable to Corning Incorporated | Per share | ||||||||||||
| As reported - GAAP | $ 14,189 | $ | 4,506 | $ 1,316 | $ | 1.54 | |||||||||
| Constant-currency adjustment(1) | 616 | 483 | 369 | 0.43 | |||||||||||
| Translation gain on Japanese yen-denominated debt(2) | (146 | ) | (0.17 | ) | |||||||||||
| Translated earnings contract gain, net(3) | (267 | ) | (0.31 | ) | |||||||||||
| Acquisition-related costs(4) | 109 | 0.13 | |||||||||||||
| Discrete tax items and other tax-related adjustments(5) | 84 | 0.10 | |||||||||||||
| Restructuring, impairment and other charges and credits(6) | 337 | 316 | 0.37 | ||||||||||||
| Litigation, regulatory and other legal matters(7) | 77 | 0.09 | |||||||||||||
| Pension mark-to-market adjustment(8) | 1 | 10 | 0.01 | ||||||||||||
| Gain on investments(9) | (8 | ) | (0.01 | ) | |||||||||||
| Gain on sale of business(10) | (41 | ) | (0.05 | ) | |||||||||||
| Contingent Consideration(11) | (25 | ) | (0.03 | ) | |||||||||||
| Core performance measures | $ 14,805 | $ | 5,327 | $ 1,794 | $ | 2.09 | |||||||||
| Net Sales | Gross Margin | Net income attributable to Corning Incorporated | Per share | ||||||||||
| As reported - GAAP | $ | 12,588 | $ | 3,931 | $ 581 | $ | 0.68 | ||||||
| Constant-currency adjustment(1) | 992 | 744 | 550 | 0.64 | |||||||||
| Translation gain on Japanese yen-denominated debt(2) | (81 | ) | (0.09 | ) | |||||||||
| Translated earnings contract gain(3) | (130 | ) | (0.15 | ) | |||||||||
| Acquisition-related costs(4) | 90 | 0.10 | |||||||||||
| Discrete tax items and other tax-related adjustments(5) | 34 | 0.04 | |||||||||||
| Restructuring, impairment and other charges and credits(6) | 283 | 378 | 0.44 | ||||||||||
| Litigation, regulatory and other legal matters(7) | (5 | ) | 54 | 0.06 | |||||||||
| Pension mark-to-market adjustment(8) | 12 | 0.01 | |||||||||||
| Gain on investments(9) | (10 | ) | (0.01 | ) | |||||||||
| Gain on sale of assets(10) | (20 | ) | (15 | ) | (0.02 | ) | |||||||
| Core performance measures | $ | 13,580 | $ | 4,933 | $ 1,463 | $ | 1.70 | ||||||
See “Items ExcludedAdjusted from GAAP Measures” for the descriptions of the footnoted reconciling items.
| 105 |
Appendix A
CORNING INCORPORATED AND SUBSIDIARY COMPANIES
RECONCILIATION OF NON-GAAP MEASURES
Year Ended December 31, 2022
(Amounts in millions, except per share amounts)
| Net Sales | Gross Margin | Net income attributable to Corning Incorporated | Per share | ||||||||||
| As reported - GAAP | $ | 14,189 | $ | 4,506 | $ 1,316 | $ | 1.54 | ||||||
| Constant-currency adjustment(1) | 616 | 483 | 369 | 0.43 | |||||||||
| Translation gain on Japanese yen-denominated debt(2) | (146 | ) | (0.17 | ) | |||||||||
| Translated earnings contract gain(3) | (267 | ) | (0.31 | ) | |||||||||
| Acquisition-related costs(4) | 109 | 0.13 | |||||||||||
| Discrete tax items and other tax-related adjustments(5) | 84 | 0.10 | |||||||||||
| Restructuring, impairment and other charges and credits(6) | 337 | 316 | 0.37 | ||||||||||
| Litigation, regulatory and other legal matters(7) | 77 | 0.09 | |||||||||||
| Pension mark-to-market adjustment(8) | 1 | 10 | 0.01 | ||||||||||
| Gain on investments(9) | (8 | ) | (0.01 | ) | |||||||||
| Gain on sale of business(11) | (41 | ) | (0.05 | ) | |||||||||
| Contingent Consideration(12) | (25 | ) | (0.03 | ) | |||||||||
| Core performance measures | $ | 14,805 | $ | 5,327 | $ 1,794 | $ | 2.09 | ||||||
See “Items Adjusted from GAAP Measures” for the descriptions of the footnoted reconciling items.
| 106 | CORNING |
Appendix A
CORNING INCORPORATED AND SUBSIDIARY COMPANIES
RECONCILIATION OF NON-GAAP MEASURES
Year Ended December 31, 2021
(Unaudited; amountsAmounts in millions, except per share amounts)
| Net Sales | Gross Margin | Net income attributable | Per share | |||||||||||
| As reported - GAAP | $ | 14,082 | $ | 5,063 | $ | 1,906 | $ | 1.28 | ||||||
| Preferred stock redemption(a) | 0.90 | |||||||||||||
| Subtotal | 14,082 | 5,063 | 1,906 | 2.18 | ||||||||||
| Constant-currency adjustment(1) | 38 | 81 | 76 | 0.09 | ||||||||||
| Translation gain on Japanese yen-denominated debt(2) | (138 | ) | (0.16 | ) | ||||||||||
| Translated earnings contract gain, net(3) | (273 | ) | (0.32 | ) | ||||||||||
| Acquisition-related costs(4) | 18 | 123 | 0.15 | |||||||||||
| Discrete tax items and other tax-related adjustments(5) | (24 | ) | (0.03 | ) | ||||||||||
| Restructuring, impairment and other charges and credits(6) | 80 | 78 | 0.09 | |||||||||||
| Litigation, regulatory and other legal matters(7) | 27 | 0.03 | ||||||||||||
| Pension mark-to-market adjustment(8) | 25 | 0.03 | ||||||||||||
| Loss on investment(9) | 17 | 0.02 | ||||||||||||
| Gain on sale of business(10) | (46 | ) | (0.05 | ) | ||||||||||
| Preferred stock conversion(12) | 17 | 0.02 | ||||||||||||
| Bond redemption loss(13) | 23 | 0.03 | ||||||||||||
| Core performance measures | $ | 14,120 | $ | 5,242 | $ | 1,811 | $ | 2.07 | ||||||
| Net Sales | Gross Margin | Net income attributable to Corning Incorporated | Per share | ||||||||||
| As reported - GAAP | $14,082 | $ | 5,063 | $ 1,906 | $ | 1.28 | |||||||
| Preferred stock redemption(a) | 0.90 | ||||||||||||
| Subtotal | 14,082 | 5,063 | 1,906 | 2.18 | |||||||||
| Constant-currency adjustment(1) | 38 | 81 | 76 | 0.09 | |||||||||
| Translation gain on Japanese yen-denominated debt(2) | (138 | ) | (0.16 | ) | |||||||||
| Translated earnings contract gain(3) | (273 | ) | (0.32 | ) | |||||||||
| Acquisition-related costs(4) | 18 | 123 | 0.15 | ||||||||||
| Discrete tax items and other tax-related adjustments(5) | (24 | ) | (0.03 | ) | |||||||||
| Restructuring, impairment and other charges and credits(6) | 80 | 78 | 0.09 | ||||||||||
| Litigation, regulatory and other legal matters(7) | 27 | 0.03 | |||||||||||
| Pension mark-to-market adjustment(8) | 25 | 0.03 | |||||||||||
| Loss on investment(9) | 17 | 0.02 | |||||||||||
| Gain on sale of business(11) | (46 | ) | (0.05 | ) | |||||||||
| Preferred stock conversion(13) | 17 | 0.02 | |||||||||||
| Bond redemption loss(14) | 23 | 0.03 | |||||||||||
| Core performance measures | $ | 14,120 | $ | 5,242 | $ 1,811 | $ | 2.07 | ||||||
| (a) | Pursuant to the Share Repurchase Agreement, the Preferred Stock was converted into 115 million Common Shares. Corning immediately repurchased 35 million of the converted Common Shares and excluded them from the weighted-average common shares outstanding for the calculation of the Company’s basic and diluted earnings per share. The redemption of these Common Shares resulted in an $803 million reduction of retained earnings which reduced the net income available to common |
See “Items Excluded from GAAP Measures” for the descriptions of the footnoted reconciling items.
Appendix A
CORNING INCORPORATED AND SUBSIDIARY COMPANIES
RECONCILIATION OF NON-GAAP MEASURES
Year Ended December 31, 2020
(Unaudited; amounts in millions, except per share amounts)
| Net Sales | Gross Margin | Net income attributable | Per share | |||||||||||||
| As reported - GAAP | $ | 11,303 | $ | 3,531 | $ | 512 | $ | 0.54 | ||||||||
| Constant-currency adjustment(1) | 44 | 25 | 17 | 0.02 | ||||||||||||
| Translation loss on Japanese yen-denominated debt(2) | 67 | 0.09 | ||||||||||||||
| Translated earnings contract (gain) loss, net(3) | (7 | ) | 36 | 0.05 | ||||||||||||
| Acquisition-related costs(4) | 23 | 114 | 0.15 | |||||||||||||
| Discrete tax items and other tax-related adjustments(5) | (24 | ) | (0.03 | ) | ||||||||||||
| Restructuring, impairment and other charges and credits(6) | 443 | 621 | 0.80 | |||||||||||||
| Litigation, regulatory and other legal matters(7) | 120 | 0.16 | ||||||||||||||
| Pension mark-to-market adjustment(8) | 24 | 0.03 | ||||||||||||||
| Gain on investment(9) | (83 | ) | (0.11 | ) | ||||||||||||
| Bond redemption loss(13) | 17 | 0.02 | ||||||||||||||
| Equity in losses of affiliated companies(14) | 98 | 0.13 | ||||||||||||||
| Transaction-related gain, net(15) | (387 | ) | (0.50 | ) | ||||||||||||
| Cumulative adjustment related to customer contract(16) | 105 | 105 | 105 | 0.14 | ||||||||||||
| Core performance measures | $ | 11,452 | $ | 4,120 | $ | 1,237 | $ | 1.39 | ||||||||
See “Items ExcludedAdjusted from GAAP Measures” for the descriptions of the footnoted reconciling items.
CORNING INCORPORATED AND SUBSIDIARY COMPANIES
RECONCILIATION OF NON-GAAP MEASURES
Year Ended December 31, 20222023 and 20212022
(Unaudited; amounts in millions)
| Year ended December 31, | ||||||||||||
| 2022 | 2021 | |||||||||||
| Cash flows from operating activities | $ 2,615 | $ 3,412 | ||||||||||
| Capital Expenditures | $(1,604 | ) | $(1,637 | ) | ||||||||
| Adjusted free cash flow based on GAAP results | $ 1,011 | $ 1,775 | ||||||||||
| Realized gains on translated earnings contracts | 300 | 67 | ||||||||||
| Translation losses on cash balances | (68 | ) | (77 | ) | ||||||||
| Adjusted free cash flow based on core results | $ 1,243 | $ 1,765 | ||||||||||
| Other adjustments(1) | (200 | ) | ||||||||||
| Adjusted free cash flow for compensation purposes | $ 1,243 | $ 1,565 | ||||||||||
| Year ended December 31, | |||||||||
| 2023 | 2022 | ||||||||
| Cash flows from operating activities | $ 2,005 | $ 2,615 | |||||||
| Realized gains on translated earnings contracts | 326 | 300 | |||||||
| Translation losses on cash balances | (61 | ) | (68 | ) | |||||
| Adjusted cash flows from operating activities | $ 2,270 | $ 2,847 | |||||||
| Less: Capital Expenditures | $ 1,390 | $ 1,604 | |||||||
| Adjusted free cash flow | $ 880 | $ 1,243 | |||||||
Appendix A
CORNING INCORPORATED AND SUBSIDIARY COMPANIES
Items ExcludedCORE PERFORMANCE MEASURES
In managing the Company and assessing our financial performance, we adjust certain measures included in our consolidated financial statements to exclude specific items to arrive at our core performance measures. These items include the impact of translating the Japanese yen-denominated debt, the impact of the translated earnings contracts, acquisition-related costs, certain discrete tax items and other tax-related adjustments, restructuring, impairment and other charges and credits, certain litigation, regulatory and other legal matters, pension mark-to-market adjustments and other items which do not reflect the ongoing operating results of the Company.
In addition, because a significant portion of our revenues and expenses are denominated in currencies other than the U.S. dollar, management believes it is important to understand the impact on sales and net income of translating these currencies into U.S. dollars. Therefore, management utilizes constant-currency reporting for the Display Technologies, Specialty Materials, Environmental Technologies and Life Sciences segments to exclude the impact from the Japanese yen, South Korean won, Chinese yuan, New Taiwan dollar and euro, as applicable to the segment. The most significant constant-currency adjustment relates to the Japanese yen exposure within the Display Technologies segment. The constant-currency rates established for our core performance measures are internally derived long-term management estimates, which are closely aligned with our hedging instrument rates. These hedging instruments may include, but are not limited to, foreign exchange forward or option contracts and foreign-denominated debt. For details of the rates used, please see the footnotes to the “Reconciliation of Non-GAAP Measures” section.
We believe that the use of constant-currency reporting allows management to understand our results without the volatility of currency fluctuations, analyze underlying trends in the businesses and establish operational goals and forecasts.
Core performance measures are not prepared in accordance with accounting principles generally accepted in the United States of America (“GAAP”). We provide investors with these non-GAAP measures to evaluate our results as we believe they are indicative of our core operating performance and provide greater transparency to how management evaluates our results and trends and makes financial and operational decisions. These measures are not, and should not be viewed as a substitute for, GAAP Measuresreporting measures. With respect to the outlook for future periods, it is not possible to provide reconciliations for these non-GAAP measures because management does not forecast the movement of foreign currencies against the U.S. dollar, or other items that do not reflect ongoing operations, nor does it forecast items that have not yet occurred or are out of management’s control. As a result, management is unable to provide outlook information on a GAAP basis.
For a reconciliation of non-GAAP performance measures to their most directly comparable GAAP financial measure, please see “Reconciliation of Non-GAAP Measures.”
| 108 | CORNING 2024 PROXY STATEMENT |
Appendix A
ITEMS ADJUSTED FROM GAAP MEASURES
Items which we excludeadjusted from GAAP measures to arrive at core performance measures are as follows:
| (1) | Constant-currency |
We believe that the use of constant-currency reporting allows management to understand our results without the volatility of currency fluctuation, analyze underlying trends in the businesses and establish operational goals and forecasts.
Constant-currency rates are as follows and are applied to all periods presented and to all foreign exchange exposures during the period, even though we may be less than 100% hedged:
| Currency | Japanese yen | Korean won | Chinese yuan | New Taiwan dollar | Euro | ||||||
| Rate | ¥107 | ₩1,175 | ¥6.7 | NT$31 | €.81 | ||||||
| (2) | Translation of Japanese yen-denominated |
| (3) | Translated earnings |
| (4) | Acquisition-related |
| (5) | Discrete tax items and other tax-related |
| (6) | Restructuring, impairment and other charges and |
| (7) | Litigation, regulatory and other legal |
| (8) | Pension mark-to-market |
| (9) | Gain (loss) on |
| (10) | Gain on sale of |
| (11) | Gain on sale of business: Amount reflects the gain recognized for the sale of a business. |
| (12) | Contingent |
| (13) | Preferred stock |
| (14) | Bond redemption | |
| CORNING |
CORNING
Corning Incorporated
One Riverfront Plaza
Corning, NY 14831-0001
U.S.A.
www.corning.com
| © |   |


 Corning


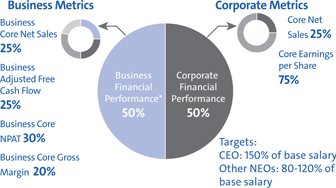

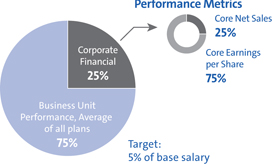
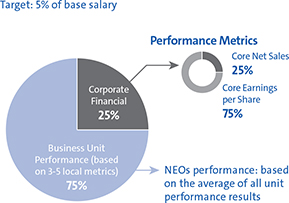
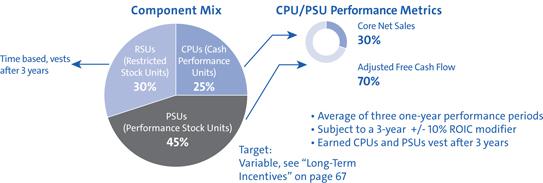


 Board composition, refreshment and diversity